6 / 6
Mar 2024

Hi,

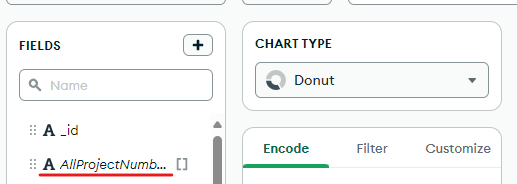
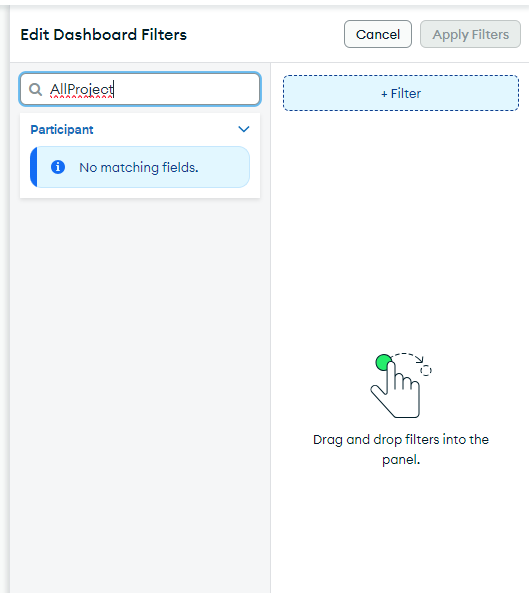
Is it possible to use Chart filters on custom computed properties? Or better yet, is there any kind of support for variables?

I have a Schema similar to:

{ NestedArrayA: [ { ProjectNumber: "1" }, { ProjectNumber: "2" } ], NestedArrayB: [ { ProjectNumber: "2" }, { ProjectNumber: "6" } ] }

I need to create charts that summarise the number of documents matching a ProjectNumber in either (and in both) collections so I can’t use a filter as that would force matching one or both.

Is there any way to define a custom filter/variable for “ProjectNumber” that I can use in the chart queries?

Yes, you can do this either by adding a calculated field, or by putting a custom pipeline into the query bar. In either case, the resulting value will be shown in the field panel and can be used for filtering.

Tom

Thanks for your reply @tomhollander.

I might be missing something here. I’ve added a computed field AllProjectNumbers to an individual Chart with the aggregation:

{ $setUnion: [ "$NestedArrayA.ProjectNumber", "$NestedArrayB.ProjectNumber" ], }

image

When I try to add a Dashboard filter- I might not have been clear it was a dashboard filter I want to add. My computed field itsn’t an option and I have no option to add “missing” fields.

The reason I’d like to use a Dashboard filter is to allow users of the Dashboard to select a Project Number to be used in a number of charts.

Ah sorry I missed that you were trying to use dashboard filters. Dashboard filters do not allow you to use fields defined in individual charts. However you can create a Charts View on the Data Sources page containing your pipeline, and then you can use that in the dashboard filters.

Tom

Closed on Mar 26, 2024

This topic was automatically closed 5 days after the last reply. New replies are no longer allowed.