Hi,
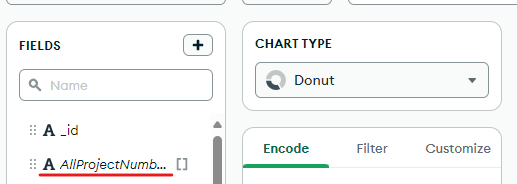
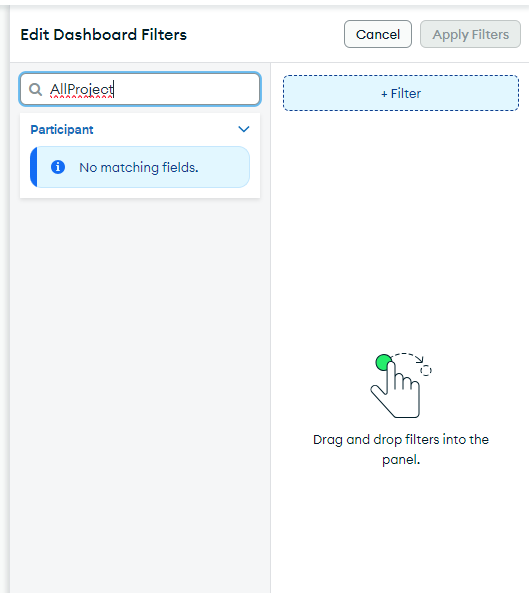
Is it possible to use Chart filters on custom computed properties? Or better yet, is there any kind of support for variables?
I have a Schema similar to:
{
  NestedArrayA: [ { ProjectNumber: "1" }, { ProjectNumber: "2" } ],
  NestedArrayB: [ { ProjectNumber: "2" }, { ProjectNumber: "6" } ]
}
I need to create charts that summarise the number of documents matching a ProjectNumber in either (and in both) collections so I can’t use a filter as that would force matching one or both.
Is there any way to define a custom filter/variable for “ProjectNumber” that I can use in the chart queries?


