Query Targeting - false alerts?

Hi

From time to time, like once per day typically, one of my M10 cluster complains: "
Query Targeting: Scanned Objects / Returned has gone above 1000".

This alert does not tell any specific query or anything. It just gives a link to query profiler and there is nothing interesting there. Also, this alert before I notice it is always closed 10 minutes later.

This M10 cluster is development and its really calm. It has only set of active watcher instances, that execute getMore (via Watch interface) on each collection. In Query Profiler, I see that all the queries are getMore, getMore, and just more of getMore, because TryNext is always called in the loop. I saw it uses getMore under the hood. From interesting things, is that, when I examine any getMore via profiler, I see documents scanned are almost always around 300, and amount returned is 0 (which is expected from dev env, which barely gets any updates). This is even when getMore is executed on collection with 20 documents in total. Is it because it somewhat divides by 0 and sees over 1000? And why is this query profiler suggesting some indices if oplog cannot have any?

Or maybe this Golang driver somehow does not update cluster time for each TryNext and it gets somewhat behind?

Apart from getMore, I have just plenty of config sessions updates (I guess some internal, so it cant be the issue?)

Performance advisor does not have any recommendations apart from dropping unused indexes.

Am I missing something? Thanks

Let me maybe recap with pictures:

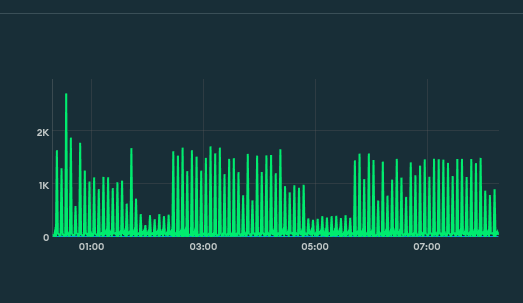
First, yes, I can see Query targetting metric is wild:
QueryTargettingHigh

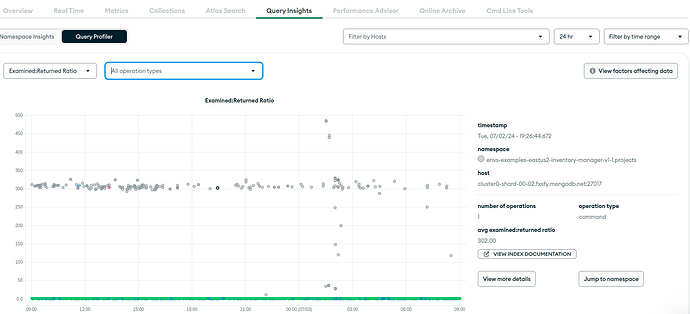
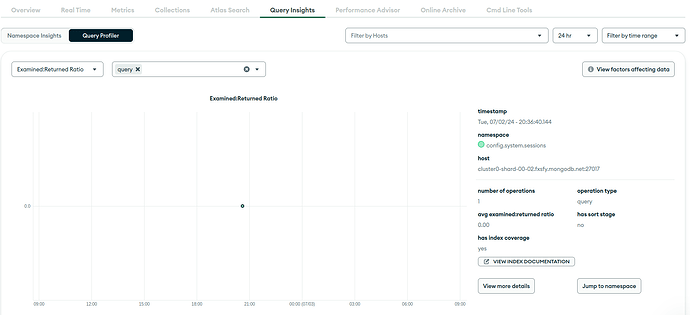
So, performance advisor and query profiler should tell something, I thought. But not much infortunately, performance advisor is green. Query profiler at best produces:

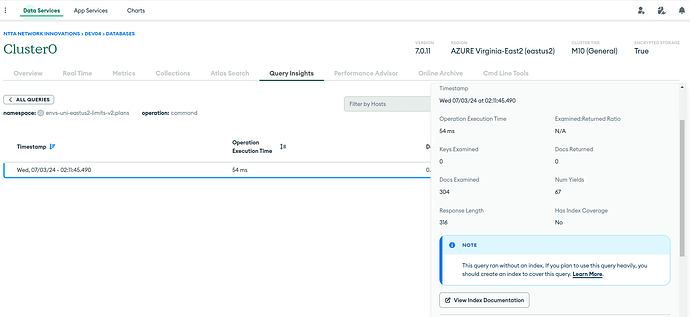
Here, typically we produce at most “command” queries with typically around 300 docs (scanned to returned ratio). However, if I actually click on some random query with around 300 ratio, I see that 300 is a bit misleading, because proper value is N/A (returned is 0):

If I see more details, it shows it is getMore, which as far as I understand, operates on oplog, so no index are possible here at all.

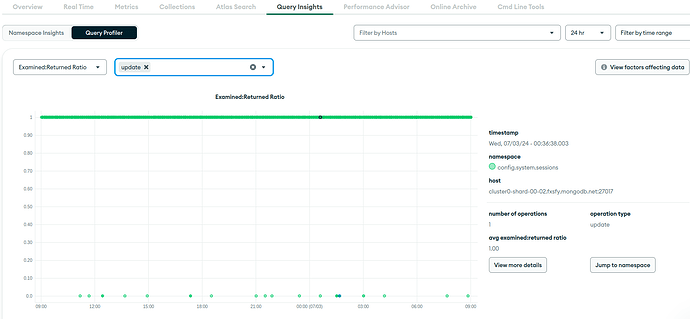
The thing is,why this is around 300 in the first place? Taking quick look at the envs, 300 is approximate nuber of active watch queries, each probably making under the hood getMore query. We have like number of databases over 30, each with some number of collections. Each collection has like typically 1-2 watchers at worst. Therefore, I have impression that all watchers across databases and collections, when they watch something, they look into same collection and this is NOT covered by any index, because it is oplog? Also, session updates are dominant queries:

Queries of their own have nothing much:

I cant help but feel that MongoDB has something non optimized there. It produces probably some updates for each individual watch session (in internal collection), and querying those are outside of index. And this reports high query targeting alert. But again, I dont feel like I have any influence over it. I noticed long time ago those watch queries are very slow and non-scalable (hebce I have now central watch query per each collection from which I can support thousands of smaller watchers). But I thought at least that watchers across collections & databases should not interfere with each other that much. But it looks that MongoDB has issues even with this? Or am I wrong? But if so, no docs points me to any solution.

Thanks.