I probably read the whole documentation for triggers and found no way to do it.
Skip to main content

This can be retrieved programmatically via the Atlas API.
https://www.mongodb.com/docs/atlas/reference/api-resources-spec/v2/#tag/Monitoring-and-Logs/operation/getDiskMeasurements
# Fetch Free Space for Data partition for one process
curl -s -u 'API_PUBLIC_KEY:API_PRIVATE_KEY' \
-H "Accept: application/vnd.atlas.2025-02-19+json" \
--digest "https://cloud.mongodb.com/api/atlas/v2/groups/588fc162d383ad09d65f7ae2/processes/atlas-wg5ldy-shard-00-00.9qfvh.mongodb.net:27017/disks/data/measurements?granularity=PT5M&period=PT5M&m=DISK_PARTITION_SPACE_PERCENT_FREE" | jq '.measurements'
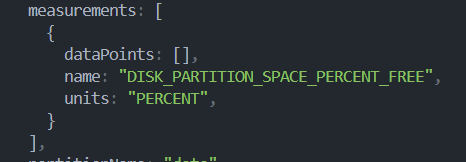
[
{
"dataPoints": [
{
"timestamp": "2025-02-26T01:39:20Z",
"value": 79.26505344784972
}
],
"name": "DISK_PARTITION_SPACE_PERCENT_FREE",
"units": "PERCENT"
}
]
how to you manage api keys inside triggers? do you hardcode them? Or is there any better way to do it?
I’m not sure this could be achieve through a trigger or not. Just pointing out the programmatic way of retrieving the disk metrics. This or the GUI are the only methods.
Hi @touhidurrr,
Usual way of handling that is via Values and Secrets, there is a better explanation here.
No matter what I do, there is no data here
This might only be available for dedicated tier clusters (M10+) what cluster type do you have ?
I am currently on M2 tier.
Hi @touhidurrr ,
Then it’s possible that you aren’t able to check the disk space, because there isn’t really a disk available to you, just a fixed amount of storage (2 GB for an M2) on a disk that you share with other tenants: you can find all the limitations of shared Clusters here
You may be able to check the space a given database is taking up (DATABASE_STORAGE_SIZE), with the getDatabaseMeasurements instead.
The question is, regardless of whether I am on shared or dedicated cluster, there is some storage allocated for me that is shown on the UI. If I can see it from the UI, then why can I not fetch this data from the API?
My question was specifically that from the beginning, how can I do it? I want to set up a trigger, that back deletes some old files based on the logical disk space percentage i am currently using. And to do that I need to access this information somehow from triggers.
Obviously I can scan all of the thousands of records I have, to calculate the total size and then compare it with total storage allocated for my tier. But it would too dumb if it was the only way to do it. Isn’t that right?
Have you tried the call suggested in the previous comment? What’s there that doesn’t answer your requirement? As explained, you’re sharing resources with other tenants, so many components (the Oplog, for example) cannot really be accounted for with a shared tier.
That wouldn’t work, as adding all documents’ sizes doesn’t take in account a few things; indexes, obviously, but also the fact that data size doesn’t necessarily match the storage size. The best bet, then, is to sum the storage size returned by the call we suggested for all the databases.
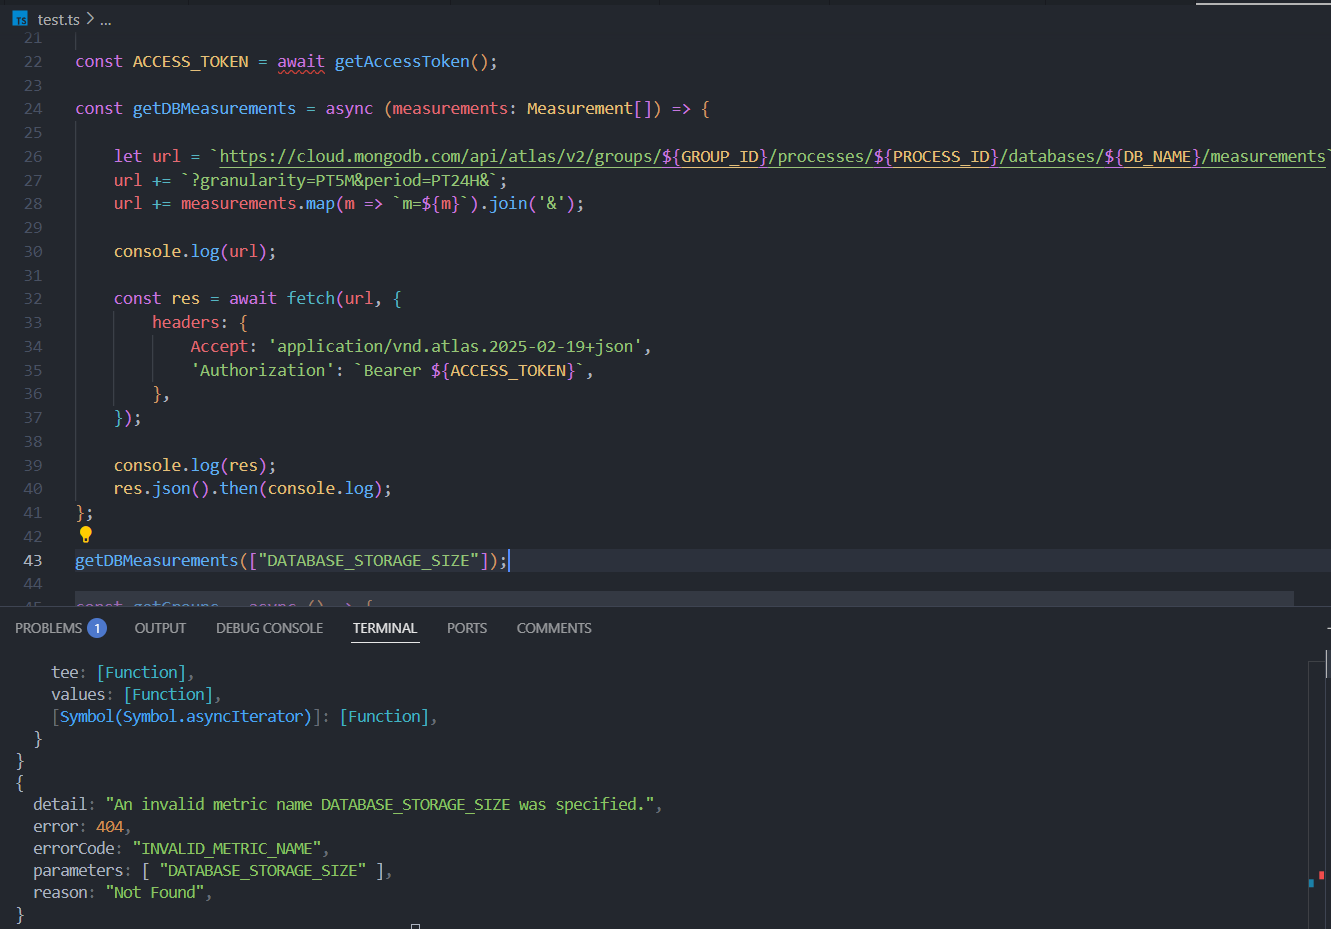
Basically any none of the metrics mentioned in this route is not working. Everything returns INVALID_METRIC_NAME
OK, I FINALLY FOUND WHAT WORKS!!!
IT IS:
I found this after going though the API step by step. Sigh.
Anyways, thanks everyone for your co-operation.
By the way, one last question. Is 1GB in MongoDB Atlast 2^30 bytes or 10^9 bytes?
Also, solution for those who might need it. You need bytes package as a dependency to run it:
const BASIC_AUTH_TOKEN = '<output of btoa(`username:secret`)>';

const GROUP_ID = '<your group id>';
const PROCESS_ID = '<your process id>';
const DB_NAME = '<your db name>';

const DB_STORAGE_SIZE = 2 * (2 ** 30) // 2GB;
// basically maintains the disk at 95% usage
const TARGET_CLEANUP_RATIO = 0.95;

const getAccessToken = () =>
  context.http
    .post({
      url: 'https://cloud.mongodb.com/api/oauth/token',
      headers: {
        Accept: ['application/json'],
        'Cache-Control': ['no-cache'],
        'Content-Type': ['application/x-www-form-urlencoded'],
        Authorization: [`Basic ${BASIC_AUTH_TOKEN}`],
      },
      body: 'grant_type=client_credentials',
    })
    .then(res => JSON.parse(res.body.text()))
    .then(data => data.access_token);

const getProcessMeasurements = (token, measurements) => {
  const url = new URL(
    `https://cloud.mongodb.com/api/atlas/v2/groups/${GROUP_ID}/processes/${PROCESS_ID}/measurements`,
  );

  url.searchParams.append('granularity', 'PT1M');
  url.searchParams.append('period', 'PT1M');
  measurements.forEach(e => url.searchParams.append('m', e));

  return context.http
    .get({
      url: url.href,
      headers: {
        'Cache-Control': ['no-cache'],
        Accept: ['application/vnd.atlas.2025-02-19+json'],
        Authorization: [`Bearer ${token}`],
      },
    })
    .then(res => JSON.parse(res.body.text()));
};

const getDBSize = token =>
  getProcessMeasurements(token, ['LOGICAL_SIZE']).then(
    data => data.measurements[0].dataPoints[0].value,
  );

exports = async function () {
  const bytes = require('bytes');
  const TOKEN = await getAccessToken();
  const DB_SIZE = await getDBSize(TOKEN);

  const CLEANUP_REQUIRED_SIZE = Math.ceil(DB_STORAGE_SIZE * TARGET_CLEANUP_RATIO);
  const CLEANUP_SIZE = DB_SIZE - CLEANUP_REQUIRED_SIZE;
  if (CLEANUP_SIZE < 0) return bytes.format(CLEANUP_SIZE);

  const files = context.services.get('unciv').db('unciv').collection('UncivServer');
  const results = await files
    .aggregate([
      { $sort: { timestamp: 1 } },
      { $limit: 1000 },
      {
        $project: {
          _id: 1,
          timestamp: 1,
          textLength: { $strLenCP: '$text' },
        },
      },
    ])
    .toArray();

  const idsToClean = [];
  let cleanupSizeCandidate = 0;
  let maxTimestamp = Date.now();
  for (const entry of results) {
    if (cleanupSizeCandidate > CLEANUP_SIZE) break;
    cleanupSizeCandidate += entry.textLength;
    maxTimestamp = entry.timestamp;
    idsToClean.push(entry._id);
  }

  return {
    maxTimestamp,
    cleanupSizeCandidate: bytes.format(cleanupSizeCandidate),
    deleteResult: await files.deleteMany({ _id: { $in: idsToClean } }),
  };
};
Closed on Mar 5
New & Unread Topics
| Topic | Replies | Views | Activity |
|---|---|---|---|
| Trigger failure due to primary node change | 1 | 703 | Apr 2024 |
| Create a collection from inside an atlas function? | 3 | 379 | Jun 2024 |
| Implementing recaptch using MongoDB - Appservice - function and React | 0 | 316 | Jun 2024 |
| Implement log Mechanism for a VMS portal | 0 | 14 | Nov 2024 |
| Scaling Limitations with MongoDB Triggers and Change Streams for Multiple Databases | 0 | 60 | Nov 2024 |