You can set chart options within an iframe by adding inline style tags and query parameters to the chart URL. Inline style tags allow you to specify display options such as height, width, background color, and border width. Query parameters allow you to specify a refresh interval for your chart, as well as a light or dark display theme.
Configure Refresh and Data Caching Behavior
The autoRefresh query parameter is a boolean that allows you to configure the chart to refresh automatically.
The maxDataAge query parameter is an integer that allows you to:
Determine the interval at which the chart refreshes if
autoRefreshistrue.Configure the maximum age of data to load from the cache when loading or manually refreshing the chart if
autoRefreshisfalseor omitted.To learn how Atlas Charts loads data from the cache when loading or refreshing the chart based on the
autoRefreshandmaxDataAgevalues, see Refresh and Data Caching Behavior.
Use the options on the Unauthenticated tab on the Embed Chart dialog to customize the autoRefresh value in the iframe snippet.
Example
The following iframe embeds a chart which automatically refreshes every 60 seconds as defined by the autoRefresh=true and the maxDataAge=60 query parameters:
<iframe style="border: none;border-radius: 2px;box-shadow: 0 2px 10px 0 rgba(70, 76, 79, .2);" width="640" height="480" src=" {charts-host}/embed/charts?id=b3ca720f-4b4a-40b4-a726-e7dc0c49aa1c& autoRefresh=true&maxDataAge=60"></iframe>
Considerations
The minimum cache duration is 60 seconds. If
autoRefreshistrueand you specify amaxDataAgevalue less than 60, the chart refreshes every 60 seconds.If you specify an
maxDataAgevalue which is not an integer or less than-1, an error is returned.If your data source requires a Verified Signature, the signature validity (including the expiry date) is checked on each refresh. If the signature's expiry date passed, the host web page must regenerate a new signature to continue rendering charts. For code examples using verified signatures, see Atlas Charts Embedding Examples on GitHub.
Example
If
autoRefreshistrue, the cache duration is one minute (maxDataAge=60), and the expiry date of the signature is in one hour, the chart refreshes every minute for an hour. Once one hour has elapsed, the chart will not and an error will be displayed as the signature is no longer valid. The host web page must regenerate a new signature to resume rendering the chart.
Specify a Display Theme
Use the theme query parameter to select a display theme:
light: chart axes and text are optimized for presentation against a light or white background.dark: chart axes and text are optimized for presentation against a dark or black background.
Choosing a theme value only updates the iframe snippet you use to embed the chart in your application. The chart is not saved with a theme value. The chart renders with the light theme by default. Embedded charts that do not include the theme parameter also render with the light theme.
Note
Choosing the light or dark theme does not change the color palette that chart data elements use. All bars and marks display using the default palette or the custom palette the chart author chose.
For example, if you choose a chart bar to render in black, choosing the dark theme does not change the color of this bar to make it more visible against a dark background.
Customize Display Options
Atlas Charts adds inline style properties to the iframe snippet you copy from the UI that add a background color and a border with a box shadow to the embedded chart based on the theme you selected:
lightthemebackground:#FFFFFFdarkthemebackground:#21313Cborder:noneborder-radius:2pxbox-shadow:0 2px 10px 0 rgba(70, 76, 79, .2)width:640height:480
Change the values of the inline style properties to change how the embedded chart displays in your application.
Background Color
Change the value of the
backgroundproperty to any value supported by thebackgroundCSS property to display the chart against it. See background in the MDN Web Docs for more information.Change the
backgroundproperty totransparentto display the chart with a transparent background, allowing your application's background to display through the chart.Remove the
backgroundproperty to use the default background color of the theme you choose:#FFFFFFfor thelighttheme (default), or#21313Cfor thedarktheme.
Chart Border
Modify or remove the following properties to customize or remove the chart border:
borderborder-radiusbox-shadow
Display Theme
- You can change the value of the
themequery parameter in the iframe snippet after you paste it into your application. If you do, make sure you adjust the iframe's inline style properties to match the theme you choose.
Example
If you change the theme from light to dark, adjust the value of the background property in the iframe snippet to display the chart against a dark background.
Chart using light theme with default light theme background of #FFFFFF:
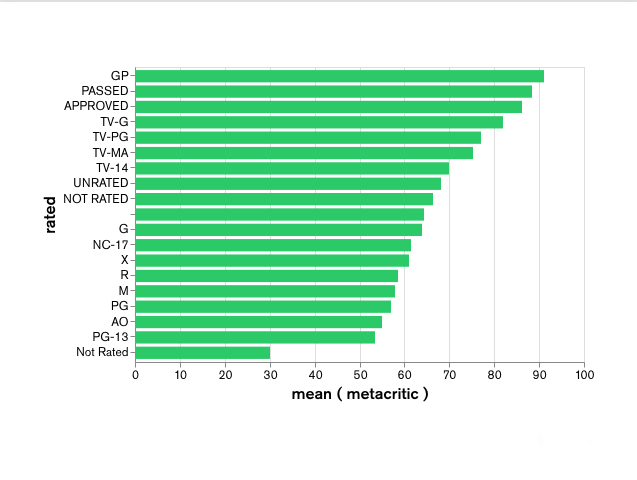
Chart using dark theme with default light theme background of #FFFFFF:
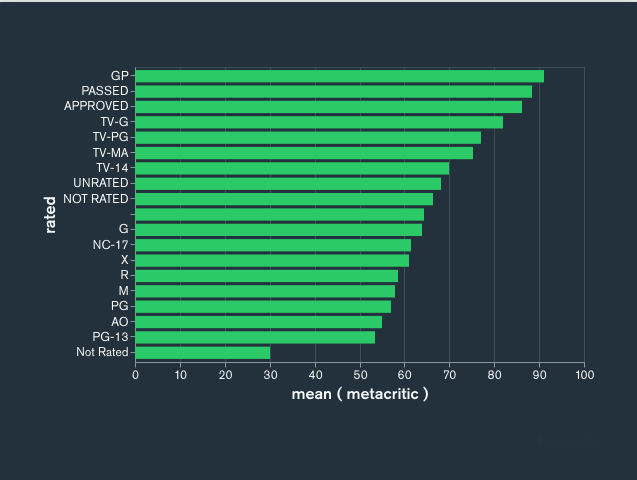
Chart using dark theme with default dark theme background of #21313C:
Iframe Example
The following iframe embeds a chart with the dark theme with the default dark theme inline style properties. The code is formatted for readability.
<iframe style=" background: #21313C;border: none;border-radius: 2px; box-shadow: 0 2px 10px 0 rgba(70, 76, 79, .2);" width="640" height="480" src=" https://charts.mongodb.com/charts-crllr/embed/charts?id=a1b2c3d4-a1b2-c3d4-9766-47b0b2daaff3& theme=dark "></iframe>
Remove the MongoDB Logo
Use the attribution query parameter with a value of false to display your embedded chart without the MongoDB logo.
The following iframe snippet renders a chart that does not display the MongoDB logo:
<iframe style="background: #FFFFFF;border: none;border-radius: 2px; box-shadow: 0 2px 10px 0 rgba(70, 76, 79, .2);" width="640" height="480" src=" https://charts.mongodb.com/mongodb-charts-twsqq/embed/charts ?id=a1b2c3d4-a1b2-c3d4-9766-47b0b2daaff3& theme=light& attribution=false "></iframe>