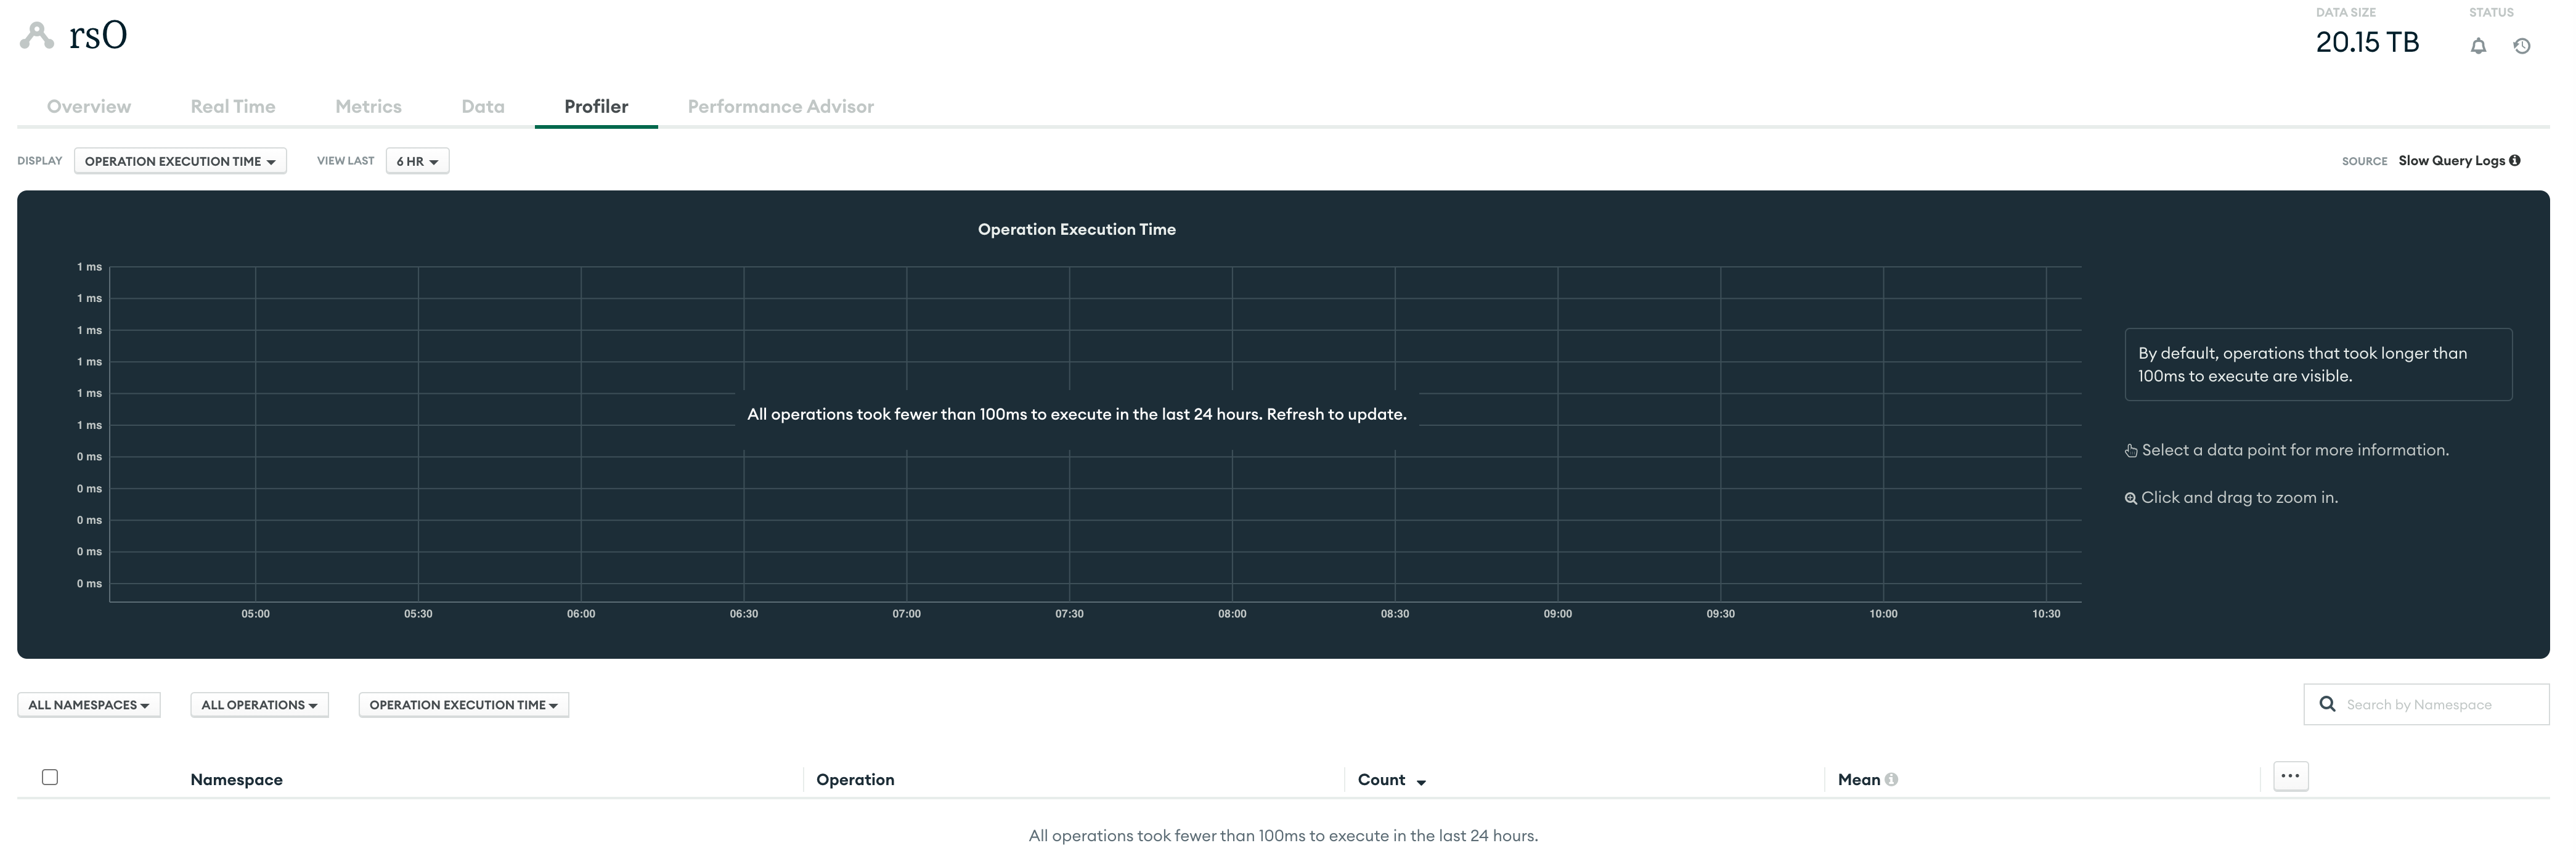
I have 5 replicaset in one project under ops manager, for one of the replicaset, there’s totally no data from the profiler page, and the rest 4 works normal.
the result for db.getProfilingStatus() was all same as
{
“was” : 0.0,
“slowms” : 100.0,
“sampleRate” : 1.0,
“ok” : 1.0,
}
so the “was”: 0.0 means the profiler is not enabled on the database level?
Where can I find any logs regarding that one replicaset… or to get the profiler show up? I am pretty sure there should be lots of slowness queries for it.