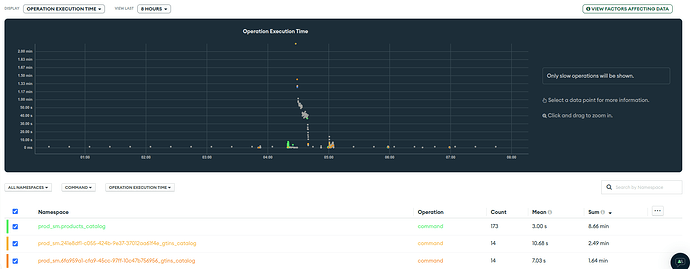
If I visit MongoDB Atlas Profiler, I can observe on each and every day a similar pattern of slow queries. It looks like this:
If ordered by Mean or Sum of operation execution time, the top 30 or more are collections with suffix _gtins_catalog that are empty, created when the user is creating an account.
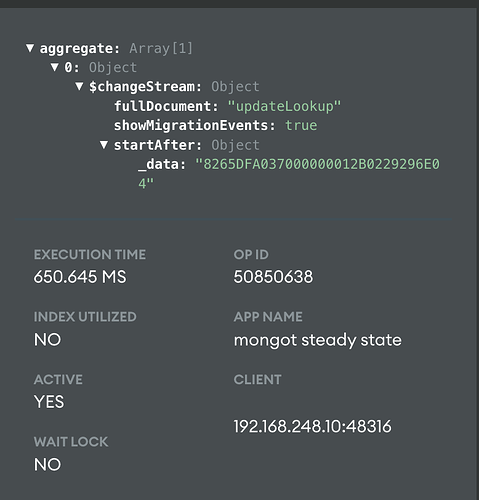
Now, when I am investigating the queries for any of these collections they are usually several of them
and all of them have pipeline like this:
"originatingCommand": {
    "aggregate": "241e8df1-c055-424b-9e37-37012aa61f4e_gtins_catalog",
    "cursor": {
      "batchSize": 0
    },
    "pipeline": [
      {
        "$changeStream": {
          "startAfter": {
            "_data": "826470CC57000000012B0229296E04"
          },
          "fullDocument": "updateLookup",
          "showMigrationEvents": true
        }
      }
    ],
    "$db": "prod_sm",
...
}
And the Operation Execution Time can even reach up to 2 min.
And now is my question. I can’t figure out what cause this pipelines to be executed, especially on empty collections, and why they are this slow. Is this some internal operations that Mongo have to perform?
It would be very helpful If someone could cast a bit of light on this.
Frank_Sun
(Frank Sun)
2
Hi @Grzegorz_Skupiewski
Thanks for being a part of MongoDB’s developer community! I’d like to take a closer look and see what may be causing this rogue command. At first glance, this does not look like an internal operation that MongoDB is running.
If you can click on one of the commands and investigate the query details, you should be able to see the “appName” that is calling this command. Would you mind checking on this and sharing what you find?
Thanks,
Frank
1 Like
Hi @Frank_Sun
Thank you for the reply, this is what you’ve asked for:
"appName": "mongot steady state"
Edit: Now as it came to my mind I probably should have mentioned, that even it these collections are empty, they have an Atlas Search Index created on them.
Hey @Grzegorz_Skupiewski - PM from Atlas Search here - can you share what cluster tier you are on?
Hi @Elle_Shwer, it is M30 (General).
I see, any chance you have a support package where you can submit a ticket about this?
Unfortunately, that is not an option for us. Any suspicions what might be a cause or hints where to look further?
Without much more info, the only interpretation I heard was: The query itself looks like the changestream mongot/AtlasSearch follows for steady state replication. It is possible for changestream queries to be slow on a collection without any writes due to writes on neighboring collections. But there is no precedent for this / it’s not something we’ve seen before. It’s hard to know beyond that.
Hi,
it seems we have the same problem here.
{
  "type": "command",
  "appName": "mongot steady state",
  "command": {
    "getMore": 4874570742714440000,
.....
}
These commands are all on empty collections with search index on them.
It seems more a bug than a problem in or data.
1 Like
Vipin_M2
(Vipin M)
10
Hello!
I started facing the same problem after I created an atlas index for my collection. unfortunately it affects the entire cluster performance.
1 Like
We’re having similar issues as well where almost all of our slow queries are related the app named “mongot steady state”.
It happens for all the collections where we’ve created Atlas search indexes
Jogi_Bethi
(Jogi Bethi)
12
We are also on M30 General Tier. Facing same issue did anyone found any solution for this??
Hi
We also see similar queries, did anyone raise this with MongoDB and get an explanation?
Hi @Frank_Sun, is there any more information available about this issue? We are also experiencing it and we have alerts firing on a regular basis due to these inefficient queries. We are going to have to increase our alert thresholds which may hide real issues.
Frank_Sun
(Frank Sun)
15
Hi @Dale_Tristram,
I wanted to share a quick update on some improvements we’re making to the query targeting alert in MongoDB Atlas.
We recently introduced Query Shape Insights for Atlas M10+ clusters running MongoDB 8.0 and above. This feature provides query targeting metrics at the individual query shape level, offering much more granular visibility into which specific query patterns may be inefficient.
We’re now working on enabling alerting on these per-shape metrics, which will allow us to deliver more targeted and actionable alerts. This will eventually replace the current query targeting alert, which is based on a serverStatus metric reported per host and can lead to noisy alerts.
If you’re finding that the current query targeting alert is firing too frequently or isn’t particularly helpful, I’d recommend increasing the alert threshold for now or increasing the notification frequency. The upcoming shape-specific alerting will provide a much clearer signal and reduce unnecessary noise.
Thanks for your continued feedback and we’re looking forward to rolling out these improvements soon!
Thanks,
Frank