dada_gore
(Dada Gore)
1
Hi,
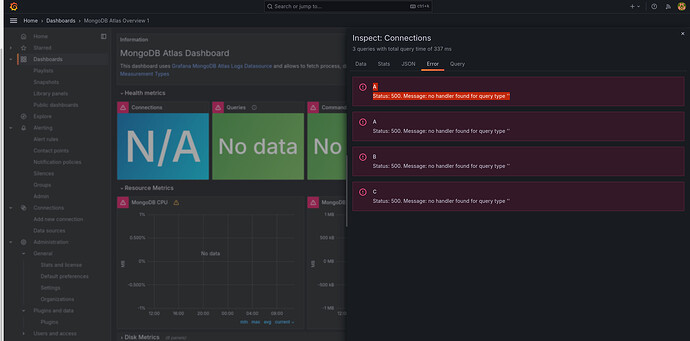
I am using the Grafana plugin grafana-mongodb-atlas-datasource to view MongoDB Atlas metrics in Grafana. However, I am encountering the following error:
Status: 500. Message: no handler found for query type ''.
Here’s a screenshot of the error message:
When I run the query from the explorer, the data is visible.
Any assistance in resolving this issue would be greatly appreciated. Thank you!
Frank_Sun
(Frank Sun)
2
Hi @dada_gore,
Welcome to the MongoDB community! I’m not too familiar with the Grafana plugin you linked. However, we do have a few grafana dashboard templates that I’ve attached below which you may find helpful.
hardware_metrics.json (121.9 KB)
mongo_metrics.json (117.1 KB)
Thanks!
Frank
thanks for the dashboard files, but when I try to import those I get this error:
failed to upgrade legacy queries grafana
any idea why or if you could share one to use?
Thanks
Frank_Sun
(Frank Sun)
4
Hi @Mohsin_Raza,
This error seems to be an issue w/ the datasource in Grafana OSS.
I believe you will need to change the datasource in Grafana to “prometheus” rather than “grafana”.
Thanks,
Frank