2 / 9
May 2024

We are seeing a huge replication lag recently on our secondary nodes. We have a 3 node replica set. We have seen replication lag go upto ~2-3 mins on the secondary. We also reviewed the mongod logs for the primary node and identified few operations that appeared to be running at the time when we observed a spike in replication lag:
op shape count
findAndModify F6C1F132 542
findAndModify ED0BE7F0 246
findAndModify F6C1F132 230
findAndModify F6C1F132 173
findAndModify F6C1F132 146

Majority of them were findAndModify. Could this be the cause? Will changing these to update help? Any suggestions/recommendations?

Thanks @Peter_Hubbard for the reply. Actually we are investigating this from a long time and also created a mongoDB support ticket. They mentioned that they reviewed the mongod logs for the primary node and this findAndModify showed up multiple times same time when we saw the huge replication lag, so asked.
we also saw couple of insert and updates same time. One insert operation stood out which was running at the time of the observed spike in replication lag and it is having execution time of around 4 minutes. We have writeConcern: {w: majority wtimeout: 0 provenance: implicitDefault}
Not sure if thats the cause or that could be a symptom of the replication lag if it’s a write that requires an acceptance of 2 nodes.

Sorry I did not understand which strategy you are referring to specifically from https://www.mongodb.com/docs/manual/tutorial/troubleshoot-replica-sets/

Things which might be causing lag times would include large inserts, high network latency, oplog too small, disks slow. You can use the troubleshooting document to narrow it down further.

Thanks for your reply. We did identify few of these reasons, but not sure why say e.g. a simple insert take around 4mins during the same time as the replication lag. whether its the cause or symptom of the lag. If you see below Insert to a collection, the waitForWriteConcernDurationMillis i.e. The time (in milliseconds) waited for the write concern to be satisfied is huge. But that could be a symptom of the replication lag if it’s a write that requires an acceptance of 2 nodes??

“totalOplogSlotDurationMicros”:268,“ninserted”:1,“keysInserted”:5,“numYields”:0,“reslen”:230,“locks”:{“ParallelBatchWriterMode”:{“acquireCount”:{“r”:2}},“FeatureCompatibilityVersion”:{“acquireCount”:{“w”:2}},“ReplicationStateTransition”:{“acquireCount”:{“w”:3}},“Global”:{“acquireCount”:{“w”:2}},“Database”:{“acquireCount”:{“w”:2}},“Collection”:{“acquireCount”:{“w”:2}},“Mutex”:{“acquireCount”:{“r”:2}}},“flowControl”:{“acquireCount”:1,“timeAcquiringMicros”:1},“readConcern”:{“level”:“local”,“provenance”:“implicitDefault”},
“writeConcern”:{“w”:“majority”,“wtimeout”:0,“provenance”:“implicitDefault”},“waitForWriteConcernDurationMillis”:249425,
“storage”:{“data”:
{“bytesRead”:8365,“timeReadingMicros”:17}},“remote”:“192.168.254.110:13601”,“protocol”:“op_msg”,“durationMillis”:249425}}

We did create a MongoDB support ticket for the same and they closed it giving some pointers mentioned below. But what should be our next steps?
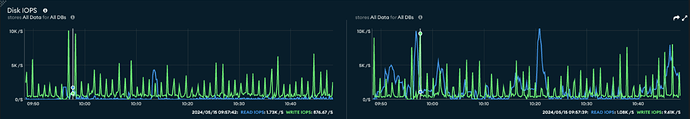
Replication lag on the secondary node 00-01 began to increase from Point A, coinciding with the spikes in write requests exceeding the configured maximum Disk IOPS of approximately 16K.
Between point A-B, we observed a high ss wt cache fill ratio, indicating significant utilization of the WT cache. Typically, eviction threads start removing cache content when this ratio falls between 80% and 95%.
Additionally, there was a notable rise in ss wt cache dirty fill ratio, representing the percentage of the total WT cache size that is dirty. Eviction threads begin evicting pages when this value reaches 5%, and it reached up to approximately 4.855%.
Around Point A, when the replication lag was approximately 4 minutes, we noticed spikes in ss metrics repl buffer count, which indicates the number of operations stored in the local replication buffer waiting to be applied.
Regarding queries, there were spikes in opcounters. During the same period, we observed very high ss metrics queryExecutor scannedObjects, indicating the number of documents scanned per second during query execution. A high ratio of “scannedObjects” to “scanned” suggests poorly indexed or unindexed queries.
Query activity included insert operations, as evidenced by spikes in ss opcountersRepl insert and ss opcountersRepl update on the primary. These metrics correlate with the disk nvme1n1 write requests issued, indicating a significant number of write operations during periods of replication lag.
Furthermore, due to the high workload of inserts, disk utilization spiked, and concurrently, Read/Write request issue related to IOPS reached around 30K/sec and exceeding the configured maximum Disk IOPS of approximately 16K.

The Majority write concern you are using must wait for a majority (ie. 2 out of 3) of nodes to write the change to disk before a confirmation is returned to the client.

It sounds more like you are exhausting the resources on your nodes due to the high volume of inserts you are creating. Remember that an insert is a relatively expensive operation especially if you have a large number of indexes. You could review the indexes you have and see if they could be combined into compound indexes, or look at your schema design and see if you can reduce the number of documents you are inserting. Failing that, make sure your cluster is correctly sized for your workload.

Just to add for US1 the cluster size is an M200, so we have 256GB RAM and 4TB storage

What is the size of your data? Frequency of inserts? Size of documents inserted? What do the Metrics in Atlas show with regard to Cache Activity, Disk IOPS and Oplog? Are you using a multi-region cluster? Are all clusters the same size?

All the 3 nodes are identical (same RAM, CPU, disks, …). This is managed by Atlas but they are all be in the same AWS region so lag should be minimal. All 3 nodes should be identical in data and schema including indexes. We don’t have special reporting replicas.
Need to check and get back on these → “What is the size of your data? Frequency of inserts? Size of documents inserted?”

oplog/hr shows in last 24 hours > 6GB/HR, almost close to 8GB/HR
cache activity on primary node I see like read into as 1.87GB/s and written from 206.488B/S
Different peaks for read/write IOPS. Peak read IOPS like 8.87K/s and write max is around 9.61K/S