To access the real-time server performance view, click the next to the connection name in the Connections Sidebar and select the Performance menu option.
Limitations
MongoDB Compass cannot retrieve performance data for collections that use Queryable Encryption.
MongoDB Compass shows limited performance data when connected to a
mongos.
Server Stats
The Performance tab displays various stats:

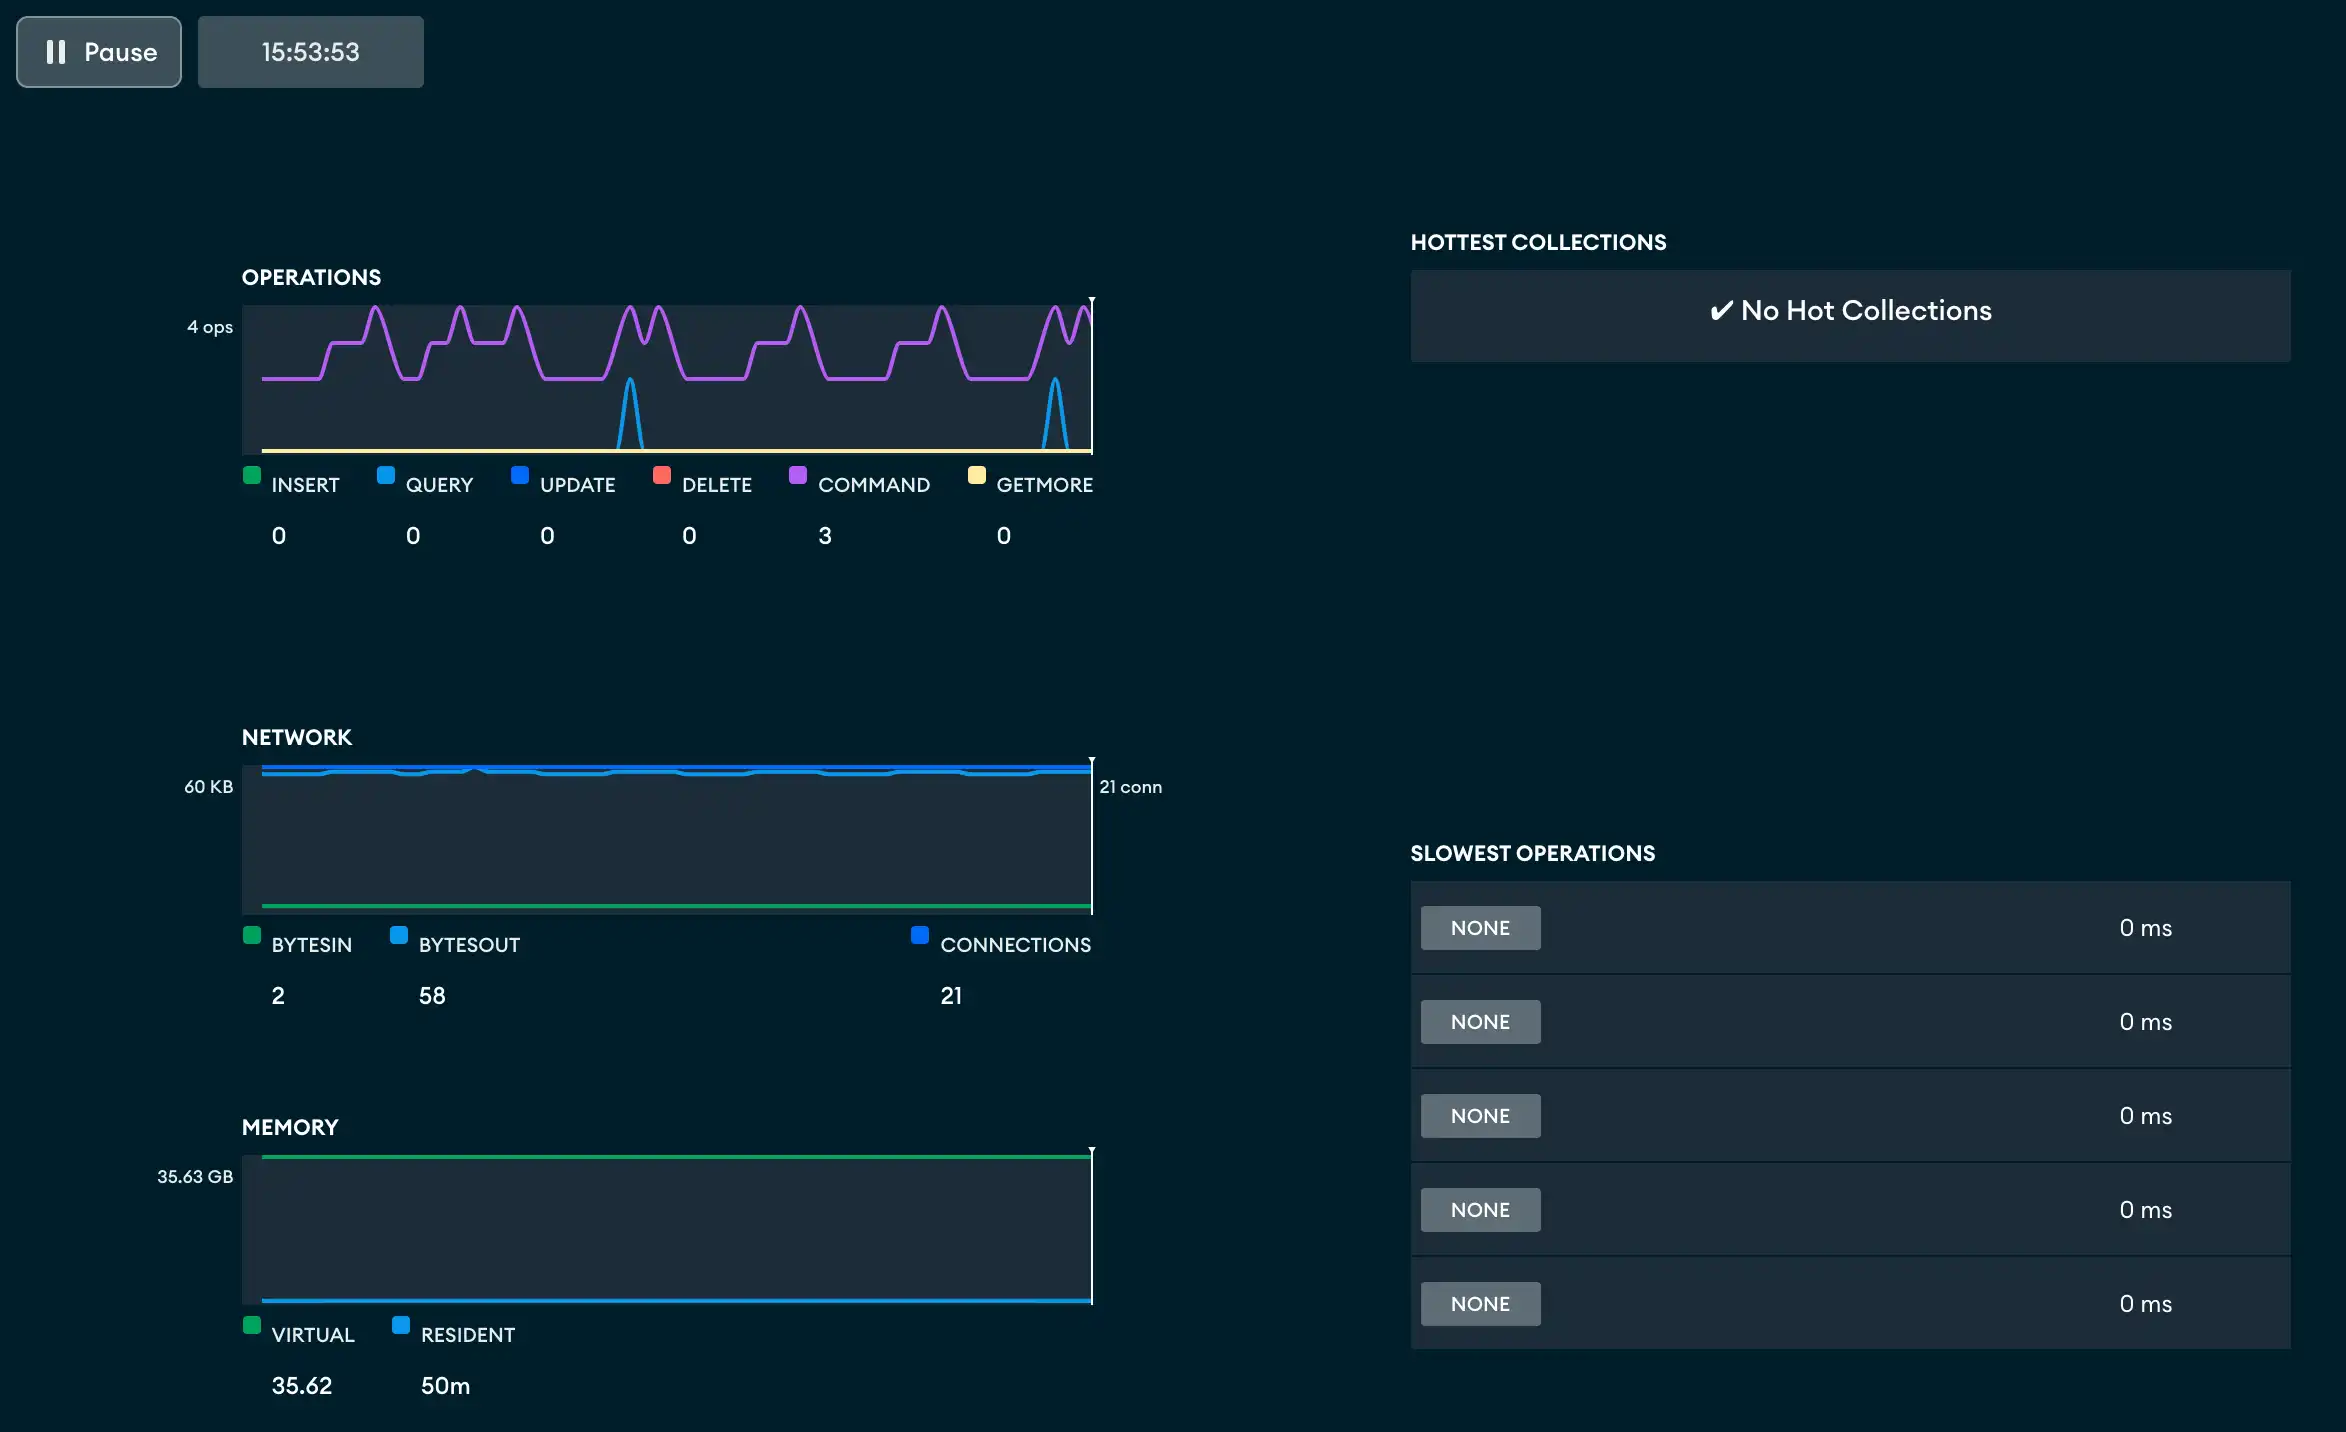
Chart/Table | Description |
|---|---|
Operations | Displays the number of operations as reported by
|
Read & Write | Displays the number of active reads, queued reads, active
writes, queued writes as reported by |
Network | Displays the number of connections as reported by
|
Memory | Displays the memory stats as reported by |
Hottest Collections | Displays the collections with the most activities as reported
by The collections correspond to a given moment in the charts; i.e. as you move over the charts, the corresponding collections are highlighted/displayed in the table. |
Slowest Operations | Displays the slowest operations as reported by db.currentOp(). The operations correspond to a given moment in the charts; i.e. as you move over the charts, the corresponding slowest operations are displayed in the table. To view the details of a slow operation or stop the operation, click on the operation. |
Stop Slow Operations
You can stop slow operations from the Performance Tab.
Important
Required Permissions
On deployments that require authentication, to stop operations that you don't own, you
must have the killop privilege action.
Pause the Display
The Pause button above the graph display pauses the update of the displays only. Pausing the performance tab does not impact the collection of the underlying data. To restart the display updates, click Play.
Next to the Pause button is a clock which shows the current time while the graphs are updating. If the display is paused, the clock shows the time at which the pause began.