You can embed a chart or dashboard into a web application with the Embedding SDK, allowing more flexible adjustments of settings and rendering.
Prerequisites
You must be a dashboard Author to enable embedding for a chart.
Procedures
Enable Embedding
Select a dashboard.
From the Dashboards page, select the dashboard containing the chart you wish to make embeddable. For instructions on navigating to dashboards, see Dashboards.
Select a chart.
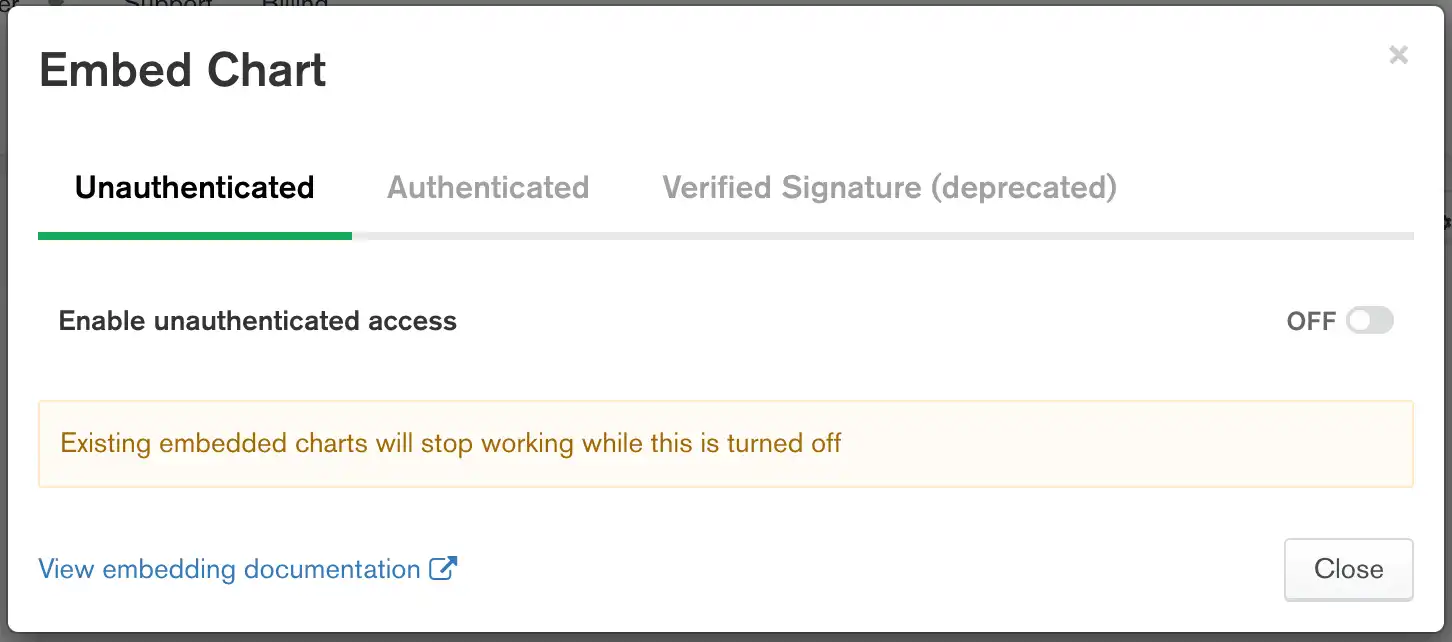
From the dashboard, click at the top-right of the chart to access its embedding information. Select Embed chart from the dropdown menu.
Note
If a chart is on a dashboard that has embedding enabled, the Embed Chart option is automatically enabled. Therefore, you can't select the Embed chart option for charts within dashboards that have embedding enabled.

(Optional) Specify filterable fields for your chart.
Specify the fields on which chart viewers can filter data. By default, no fields are specified, meaning the chart cannot be filtered until you explicitly allow at least one field.
Alternatively, you can specify all the fields in your chart by selecting Allow all fields in the data source used in this chart.
To learn more about filterable fields, see Specify Filterable Fields.
Select a dashboard.
From the Dashboards page, select the dashboard containing the chart you wish to embed. For instructions on navigating to dashboards, see Dashboards.
Select a chart.
From the dashboard, click at the top-right of the chart to access its embedding information. Select Embed chart from the dropdown menu.
Note
If a chart is on a dashboard that has embedding enabled, the Embed Chart option is automatically enabled. Therefore, you can't select the Embed chart option for charts within dashboards that have embedding enabled.

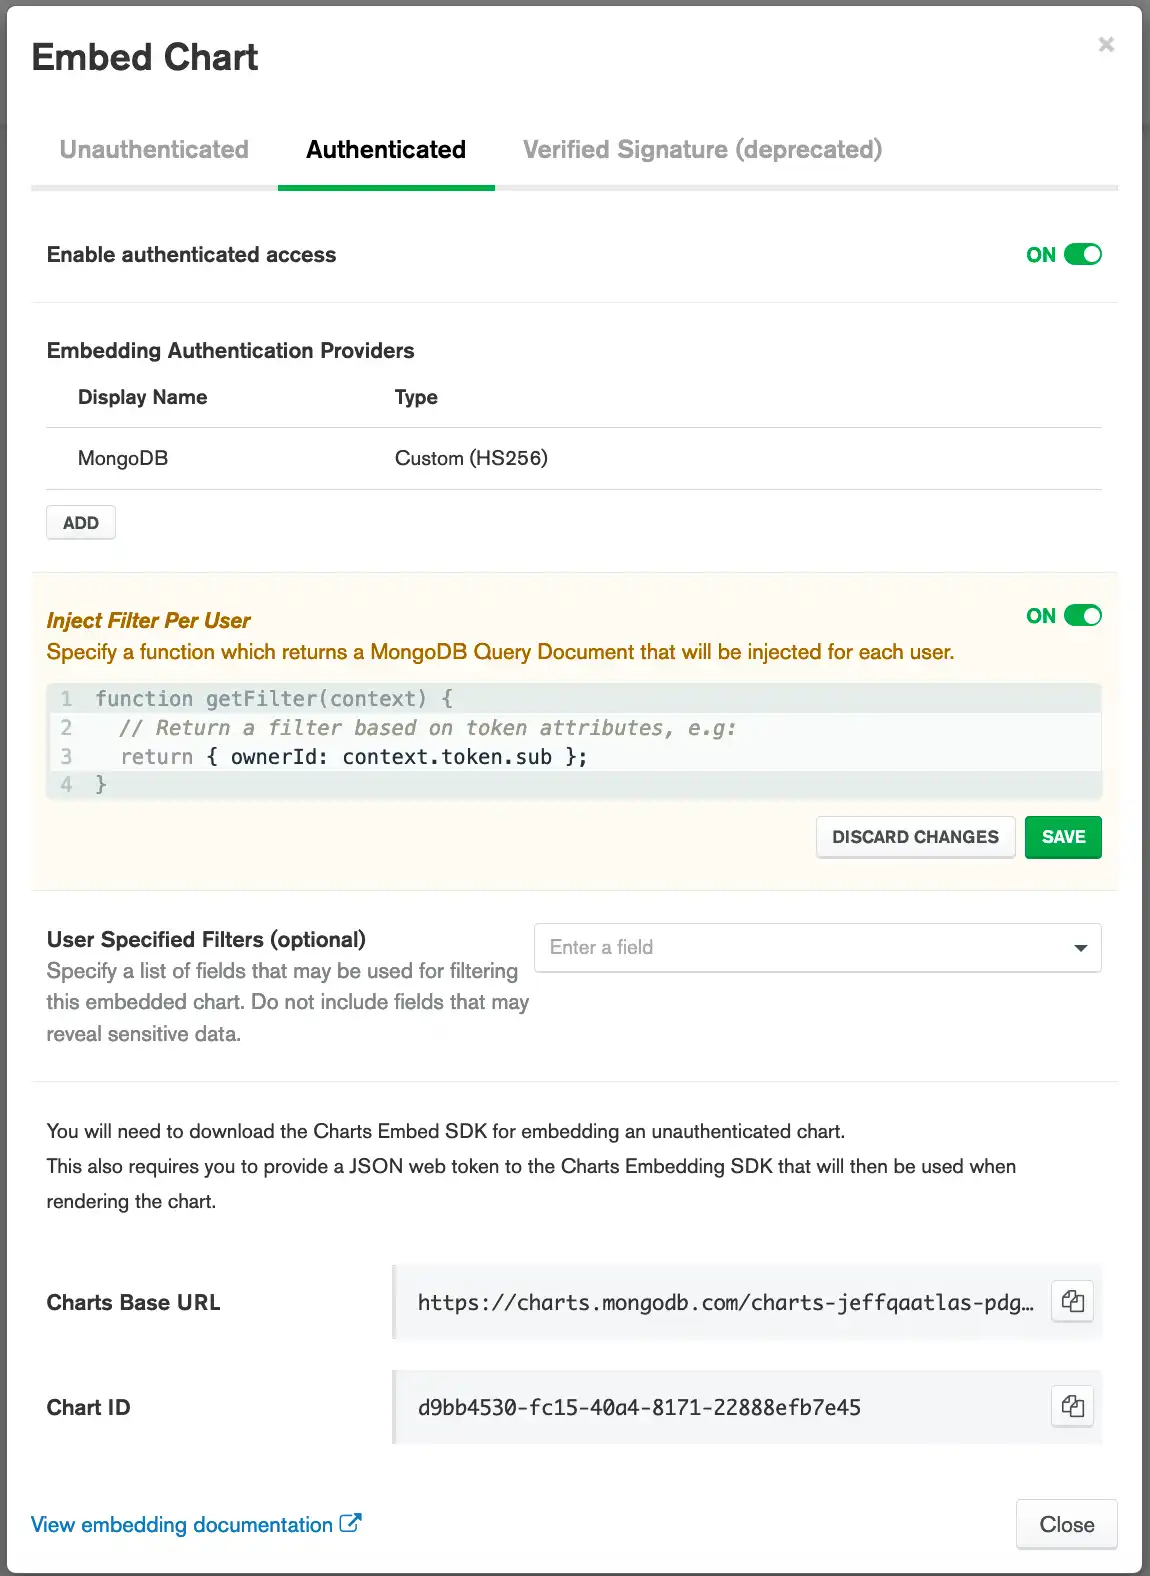
(Optional) Specify a filter function to inject per user.
You can specify a function to inject a MongoDB filter document for each user who views the chart. This is useful for rendering user-specific charts.
Example
The following filter function only renders data where the
ownerId field of a document matches the value of
the Embedding Authentication Provider's token's sub field:
function getFilter(context) { return { ownerId: context.token.sub }; }
Tip
To learn more about injecting filters per user, see Inject User-Specific Filters.
(Optional) Specify filterable fields for your chart.
Specify the fields on which chart viewers can filter data. By default, no fields are specified, meaning the chart cannot be filtered until you explicitly allow at least one field.
Tip
To learn more about filterable fields, see Specify Filterable Fields.
Configure Embedding Authentication Providers
Go to the Embedded Visualizations page.
Click Embedded Visualizations under the Services heading in the Visualization sidebar.
The Embedded Visualizations page displays.
Go to the Authentication Settings view.
Note
You must be a Project Owner to access the Authentication Settings page. As a non-admin user, you can still use embedded charts, but you must get a key from a Project Owner.
Click the Authentication Settings tab.
The Authentication Settings tab displays.
Add the authentication provider.
From the Authentication providers section, click Add.
In the Name field, enter a descriptive name for the provider.
From the Provider list, select the type of provider you want to add.
Configure Charts to verify tokens from the provider.
The values you must enter differ based on the provider you selected:
Google
In the Client ID field, enter your application's Google API Client ID, in the following format:
<prefix>.apps.googleusercontent.com Custom JWT
Provide the following values:
FieldValueSigning Algorithm
Signing Key
Secret or key used to validate the JWT signature. If tokens are not signed, Charts considers them invalid. If you provide an incorrect key, Charts is unable to verify token signatures and considers them invalid.
The value you must provide depends on the Signing Algorithm:
HS256: enter the secret key used to sign the JWT.RS256: Select either JWK or JWKS URL or PEM Public Key.If you select JWK or JWKS URL, Charts retrieves the key from the JWK or JWKS file at the specified URL. Charts then uses the key to validate the JSON web token. If there are multiple keys in the file, Charts tries each key until it finds a match. Enter the URL that contains the JWK or JWKS file.
If you choose PEM Public Key, Charts uses the specified public key to verify the JSON web token. Enter the public key of the key pair used to sign the JWT. The public key must be in PEM format, as shown in the following example:
-----BEGIN CERTIFICATE----- MIIDfjCCAmagAwIBAgIBBzANBgkqhkiG9w0BAQUFADB0MRcwFQYDVQQDEw5LZXJu ZWwgVGVzdCBDQTEPMA0GA1UECxMGS2VybmVsMRAwDgYDVQQKEwdNb25nb0RCMRYw FAYDVQQHEw1OZXcgWW9yayBDaXR5MREwDwYDVQQIEwhOZXcgWW9yazELMAkGA1UE BhMCVVMwHhcNMTQwNzE3MTYwMDAwWhcNMjAwNzE3MTYwMDAwWjBsMQ8wDQYDVQQD EwZzZXJ2ZXIxDzANBgNVBAsTBktlcm5lbDEQMA4GA1UEChMHTW9uZ29EQjEWMBQG A1UEBxMNTmV3IFlvcmsgQ2l0eTERMA8GA1UECBMITmV3IFlvcmsxCzAJBgNVBAYT AlVTMIIBIjANBgkqhkiG9w0BAQEFAAOCAQ8AMIIBCgKCAQEAp76KJeDczBqjSPJj 5f8DHdtrWpQDK9AWNDlslWpi6+pL8hMqwbX0D7hC2r3kAgccMyFoNIudPqIXfXVd 1LOh6vyY+jveRvqjKW/UZVzZeiL4Gy4bhke6R8JRC3O5aMKIAbaiQUAI1Nd8LxIt LGvH+ia/DFza1whgB8ym/uzVQB6igOifJ1qHWJbTtIhDKaW8gvjOhv5R3jzjfLEb R9r5Q0ZyE0lrO27kTkqgBnHKPmu54GSzU/r0HM3B+Sc/6UN+xNhNbuR+LZ+EvJHm r4de8jhW8wivmjTIvte33jlLibQ5nYIHrlpDLEwlzvDGaIio+OfWcgs2WuPk98MU tht0IQIDAQABoyMwITAfBgNVHREEGDAWgglsb2NhbGhvc3SCCTEyNy4wLjAuMTAN BgkqhkiG9w0BAQUFAAOCAQEANoYxvVFsIol09BQA0fwryAye/Z4dYItvKhmwB9VS t99DsmJcyx0P5meB3Ed8SnwkD0NGCm5TkUY/YLacPP9uJ4SkbPkNZ1fRISyShCCn SGgQUJWHbCbcIEj+vssFb91c5RFJbvnenDkQokRvD2VJWspwioeLzuwtARUoMH3Y qg0k0Mn7Bx1bW1Y6xQJHeVlnZtzxfeueoFO55ZRkZ0ceAD/q7q1ohTXi0vMydYgu 1CB6VkDuibGlv56NdjbttPJm2iQoPaez8tZGpBo76N/Z1ydan0ow2pVjDXVOR84Y 2HSZgbHOGBiycNw2W3vfw7uK0OmiPRTFpJCmewDjYwZ/6w== -----END CERTIFICATE-----
Audience (Optional)
Audience claim that must be present in the JWT for Charts to consider it valid.
Click Save.
Select a dashboard.
From the Dashboards page, select the dashboard to make embed. For instructions on navigating to dashboards, see Dashboards.
(Optional) Specify filterable fields for your dashboard.
Specify the fields on which dashboard viewers can filter data. By default, no fields are specified, meaning the dashboard cannot be filtered until you explicitly allow at least one field.
Alternatively, you can specify all the fields in your dashboard by selecting Allow all fields in the data source used in this dashboard.
To learn more about filterable fields, see Specify Filterable Fields.
Select a dashboard.
From the Dashboards page, select the dashboard to make embed. For instructions on navigating to dashboards, see Dashboards.
Add authentication providers.
If you have already set up authentication providers, skip this step. If you haven't yet set up authentication providers, you can do so now.
To learn more, see Configure Embedding Authentication Providers.
Click Add.
Specify a name for the authentication integration.
Select a provider and specify the provider settings.
Click Save.
Click Back to Embed Dashboard.
(Optional) Specify a filter function to inject per user.
You can specify a function to inject a MongoDB filter document for each user who views the dashboard. This is useful for rendering user-specific dashboards.
Example
The following filter function only renders data where the
ownerId field of a document matches the value of
the Embedding Authentication Provider's token's sub field:
function getFilter(context) { return { ownerId: context.token.sub }; }
Tip
To learn more about injecting filters per user, see Inject User-Specific Filters.
(Optional) Specify filterable fields for your dashboard.
Specify the fields on which dashboard viewers can filter data. By default, no fields are specified, meaning the dashboard cannot be filtered until you explicitly allow at least one field.
Alternatively, you can specify all the fields in your dashboard by selecting Allow all fields in the data source used in this dashboard.
To learn more about filterable fields, see Specify Filterable Fields.
Create a Web App
Proceed with the remaining steps to create a new app in which to display your chart.
Note
MongoDB offers a pre-built example app in the GitHub repository that shows how to use the Embedding SDK to display an unauthenticated embedded chart.
Proceed with the remaining steps to create a new app in which to display your chart.
Note
MongoDB offers a pre-built example in the GitHub repository that shows you how to use the Embedding SDK to authenticate an embedded chart using your authentication provider.
Proceed with the remaining steps to create a new app in which to display your dashboard.
Note
MongoDB offers a pre-built example of an unauthenticated embedded dashboard in the GitHub Repository. This example shows how to use the Embedding SDK to display an unauthenticated embedded dashboard.
Proceed with the remaining steps to create a new app in which to display your dasbhoard.
Note
MongoDB offers examples of authenticated embedded dashboards in the GitHub Repository. These examples show you how to use the Embedding SDK to authenticate an embedded dashboard using Google, or JWT authentication providers.
Add Embedding Code to Your App
To learn how to install the Embedding SDK into your app, see Install the Embedding SDK.
Add the following code to your web app to execute where you want your chart to render:
Note
Replace the existing Charts Base URL and chart ID with the values for the chart that you want to display. Your Charts Base URL and chart ID are visible in the embedding options modal window.
import ChartsEmbedSDK from "@mongodb-js/charts-embed-dom"; const sdk = new ChartsEmbedSDK({ baseUrl: "https://charts.mongodb.com/charts-embedding-examples-wgffp", // ~REPLACE~ with the Base URL from your Embed Chart dialog. }); const chart = sdk.createChart({ chartId: "735cfa75-15b8-483a-bc2e-7c6659511c7c", // ~REPLACE~ with the Chart ID from your Embed Chart dialog. height: "700px", // Additional options go here }); chart.render(document.getElementById("chart"));
Add the following code to your web app to execute where you want your chart to render. The following example authenticates with a Google token.
import ChartsEmbedSDK from "@mongodb-js/charts-embed-dom"; const id_token = googleUser.getAuthResponse().id_token; const ChartsEmbedSDK = window.ChartsEmbedSDK; const sdk = new ChartsEmbedSDK({ baseUrl: "https://charts.mongodb.com/charts-embedding-examples-wgffp", // Optional: replace with your Charts URL getUserToken: () => id_token, }); const chart = sdk.createChart({ chartId: "8d4dff93-e7ca-4ccd-a622-e20e8a100197", // Optional: replace with your Chart ID }); document.body.classList.toggle("logged-in", true); chart.render(document.getElementById("chart"));
Add the following code to your web app to execute where you want your dashboard to render.
Note
Replace the existing Dashboards Base URL and dashboard ID with the values for the dashboard that you want to display. Your Dashboards Base URL and dashboard ID are visible in the embedding options modal window.
import ChartsEmbedSDK from "@mongodb-js/charts-embed-dom"; const sdk = new ChartsEmbedSDK({ baseUrl: "https://charts.mongodb.com/charts-embedding-examples-wgffp", // ~REPLACE~ with the Base URL from your Embed Dashboard dialog. }); const dashboard = sdk.createDashboard({ dashboardId: "735cfa75-15b8-483a-bc2e-7c6659511c7c", // ~REPLACE~ with the Dashboard ID from your Embed Dashboard dialog. height: "700px", widthMode: "scale", heightMode: "fixed" // Additional options go here }); dashboard.render(document.getElementById("dashboard"));
Add the following code to your web app to run it where you want your dashboard to render. The following example authenticates with a Google token.
import ChartsEmbedSDK from "@mongodb-js/charts-embed-dom"; const id_token = googleUser.getAuthResponse().id_token; const ChartsEmbedSDK = window.ChartsEmbedSDK; const sdk = new ChartsEmbedSDK({ baseUrl: "https://charts.mongodb.com/charts-embedding-examples-wgffp", // Optional: ~REPLACE~ with your Base URL getUserToken: () => id_token, }); // Read https://dochub.mongodb.org/core/charts-dashboards-embedded-dashboard-options for more options const dashboard = sdk.createDashboard({ // Optional: ~REPLACE~ with your Dashboard ID dashboardId: "620c9847-fc5c-4199-865d-27b2ae20db07", theme: "dark", widthMode: "scale", }); document.body.classList.toggle("logged-in", true); dashboard.render(document.getElementById("dashboard"));