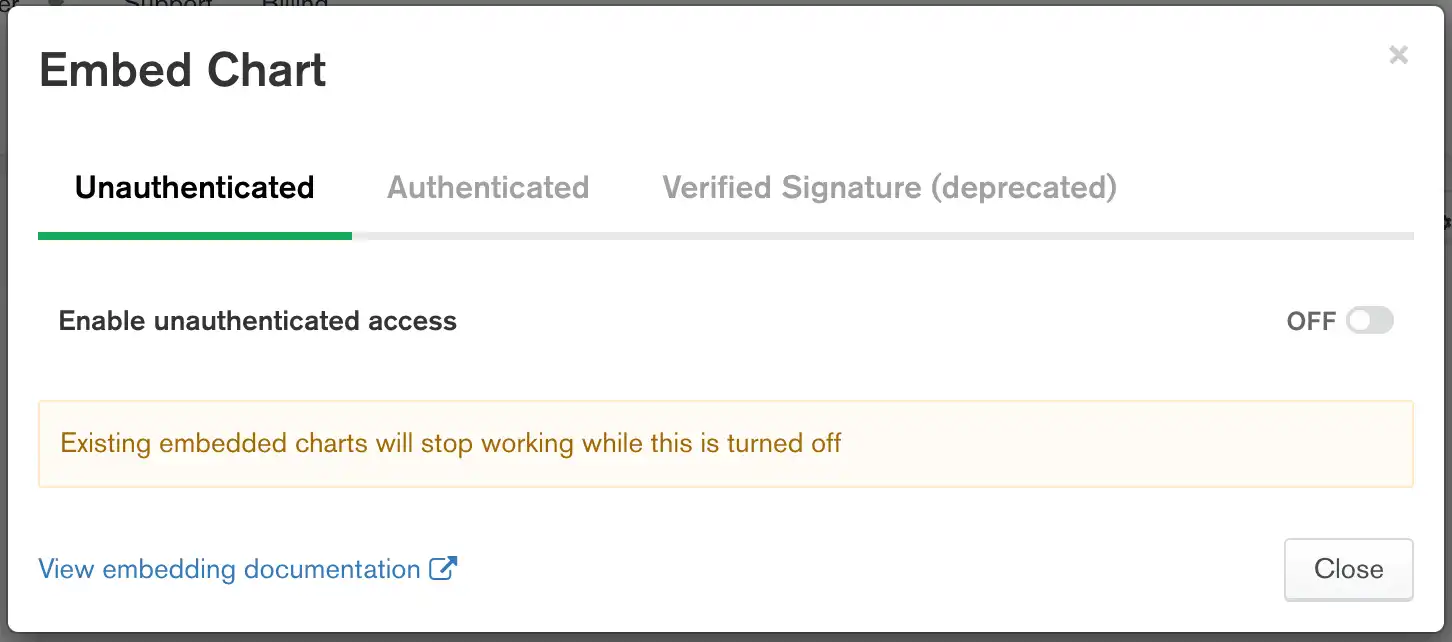
You can embed a chart into a web application with an iframe and specify settings such as height, width, refresh interval, and display theme.
Charts embedded within an iframe may be either:
Unauthenticated, in which case they are viewable by anyone.
Authenticated with a Verified Signature.
Note
Authentication with a Verified Signature is deprecated. The Embedding Charts SDK offers authentication through several authentication providers.
Prerequisites
You must be a dashboard Author to enable embedding for a chart.
Procedure
Select a dashboard.
From the Dashboards page, select the dashboard containing the chart you wish to make embeddable. For instructions on navigating to dashboards, see Dashboards.
Select a chart.
From the dashboard, click at the top-right of the chart to access its embedding information. Select Embed chart from the dropdown menu.
Note
If a chart is on a dashboard that has embedding enabled, the Embed Chart option is automatically enabled. Therefore, you can't select the Embed chart option for charts within dashboards that have embedding enabled.
(Optional) Specify filterable fields for your chart.
Specify the fields on which chart viewers can filter data. By default, no fields are specified, meaning the chart cannot be filtered until you explicitly allow at least one field.
Alternatively, you can specify all the fields in your chart by selecting Allow all fields in the data source used in this chart.
To learn more about filterable fields, see Specify Filterable Fields.
(Optional) Set additional options.
You can edit the iframe code manually to set several other chart options, including height, width, and border radius. See Embedded Chart Options for more information about chart options.
Important
Using a Verified Signature for authentication is deprecated. Instead, refer to the Authenticated Embedding tab for instructions on securing your charts.
Select a dashboard.
From the Dashboards page, select the dashboard containing the chart for which you want to enable embeddings. For instructions on navigating to dashboards, see Dashboards.
Enabled signed authentication.
Select the Verified Signature tab in the dialog box.
Toggle Enable signed authentication access to On.
The HTML code that appears in the modal window shows the required parameters for sharing a chart with authentication enabled. To use this code, you must continue with the subsequent steps to enable authenticated access.
Go to the Embedded Visualizations page.
Click Embedded Visualizations under the Services heading in the Visualization sidebar.
The Embedded Visualizations page displays.
Go to the Authentication Settings view.
Note
You must be a Project Owner to access the Authentication Settings page. As a non-admin user, you can still use embedded charts, but you must get a key from a Project Owner.
Click the Authentication Settings tab.
The Authentication Settings tab displays.
Create the server-side code necessary for a verified signature.
Generating a verified signature to accompany data requests from shared charts with authentication enabled requires server-side code. The verified signature creates a payload by generating a HMAC from your embedding key, a timestamp, and identifying data from your chart. The verified signature is valid for a limited time period specified in your server-side code.
Code examples demonstrating how to generate a verified signature are available for the following languages and platforms:
After your iframe code is ready with any options you've set, you can place it in a web page to display your chart.
