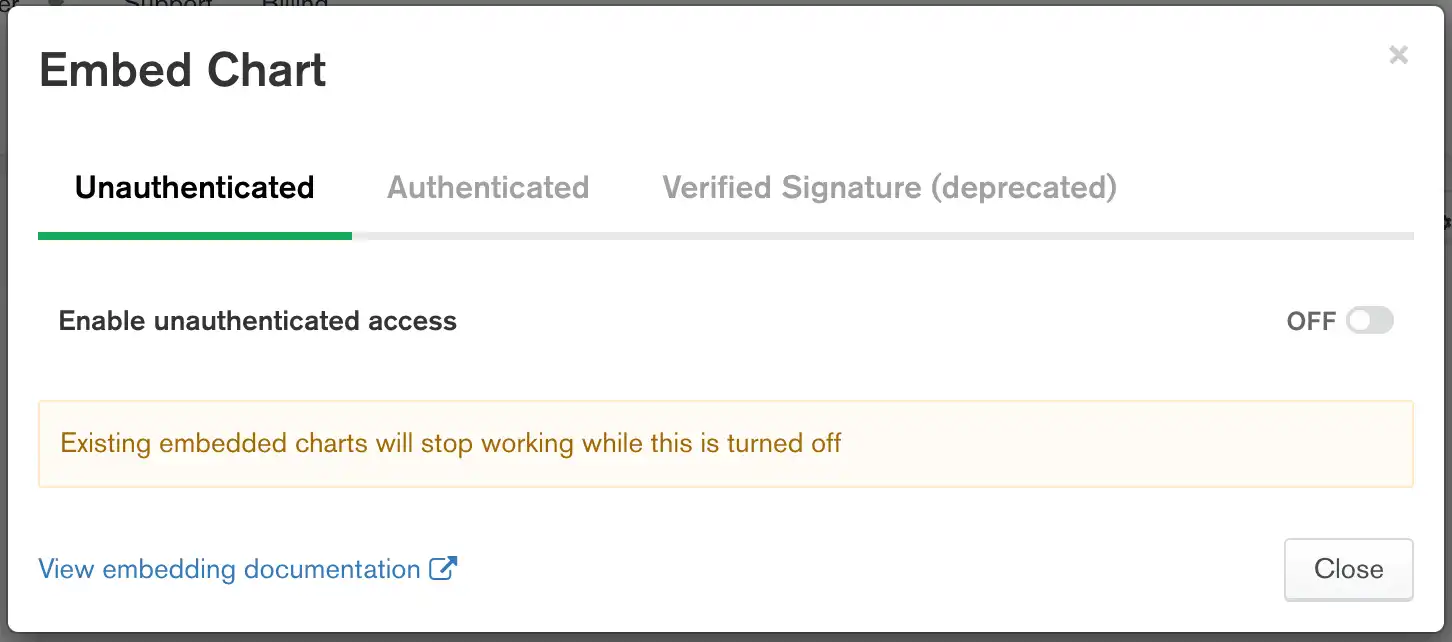
You can embed a chart in a web application and not require authentication to view chart data. To restrict access to your embedded chart, see the authenticated embedded chart tutorials.
Prerequisites
You must be a dashboard Author to enable unauthenticated embedding for a chart.
Procedures
Enable Unauthenticated Embedding for a Chart
Enable unauthenticated embedding to generate a chart ID and Charts Base URL. You will need your chart ID and Charts Base URL to display your chart on a web page.
Select a dashboard.
From the Dashboards page, select the dashboard containing the chart you wish to make embeddable. For instructions on navigating to dashboards, see Dashboards.
Select a chart.
From the dashboard, click at the top-right of the chart to access its embedding information. Select Embed chart from the dropdown menu.
Note
If a chart is on a dashboard that has embedding enabled, the Embed Chart option is automatically enabled. Therefore, you can't select the Embed chart option for charts within dashboards that have embedding enabled.
(Optional) Specify filterable fields for your chart.
Specify the fields on which chart viewers can filter data. By default, no fields are specified, meaning the chart cannot be filtered until you explicitly allow at least one field.
Alternatively, you can specify all the fields in your chart by selecting Allow all fields in the data source used in this chart.
To learn more about filterable fields, see Specify Filterable Fields.
Create a Web App to Display Your Chart
If you already have an app in which to display your chart, you're ready to add an unauthenticated embedded chart. If not, proceed with the remaining steps to create a new app.
MongoDB offers a pre-built example app in the GitHub repository that shows how to use the Embedding SDK to display an unauthenticated embedded chart.
Clone the GitHub repository
to get all the example apps. Instructions for running the
unauthenticated example are in the Readme file in the unauthenticated directory. You can
run the app as-is, or you can customize it to use a chart of your own.
Customize the Node.js App
All the lines you need to edit are marked with a comment containing
~REPLACE~.
Enter your Charts Base URL
Replace the existing Charts Base URL with the Base URL of the chart you want to display. Your Charts Base URL is visible in the embedding options modal window. See Embedding SDK for detailed instructions on enabling embedding for a chart.
const sdk = new ChartsEmbedSDK({ baseUrl: "https://charts.mongodb.com/charts-embedding-examples-wgffp" // Optional: ~REPLACE~ with the Base URL from your Embed Chart dialog });
You can also include the Embedding SDK with inline Javascript in an HTML page, as shown in the following code snippet:
<script src="https://unpkg.com/@mongodb-js/charts-embed-dom"></script>
Enter your chart ID
Replace the existing chart ID with the ID of the chart you want to display. Your chart ID is visible in the embedding options modal window. See Embedding SDK for detailed instructions on enabling embedding for a chart.
const chart = sdk.createChart({ chartId: "735cfa75-15b8-483a-bc2e-7c6659511c7c", // Optional: ~REPLACE~ with the Chart ID from your Embed Chart dialog height: "700px" // Additional options go here });
After you finish customizing the app, it's ready to run.
