Dashboards are a collection of charts assembled to create a single unified display of your data. Each chart shows data from a single MongoDB collection or view, so dashboards are essential to attain insight into multiple focal points of your data in a single display. Dashboards can be shared with other users.
Dashboards Pages
The Dashboards pages show all dashboards you have access to view in an organization or project.
To get to your organizations's Dashboards page:
Go to the Organization Dashboards page.
If the Organization Dashboards page isn't already displayed, click Organization Dashboards under the Visualizations heading in the sidebar.
The Organization Dashboards page displays.
To get to your project's Dashboards page:
Go to the Dashboards page for your project.
If the Dashboards page for your project isn't already displayed, click Project Dashboards under the Visualization heading in the sidebar.
The Dashboards page for your project displays.
To learn more about dashboard permissions in Atlas Charts, see Dashboard Permissions.
Each dashboard shows the following information:
Title
Description
A preview of the first three charts in the dashboard, including the chart title and type
When the dashboard was last modified
By default, the most recently modified dashboards are shown first in the list. You can change the sort order by using the Sort By dropdown menu.
Note
For free-tier Atlas clusters, a banner with the following text appears at the top of the dashboard:
You are on the |charts| free tier. Upgrade your cluster or navigate to a project with a paid tier to access all of |charts|!
Click :guilabel:View plans button to the right of the banner to access the billing page.
Create a New Dashboard
To create a new dashboard:
From the Dashboards page, click Add Dashboard.
In the Add Dashboard dialog, enter a Title for your dashboard. Optionally, enter a Description.
Click Save.
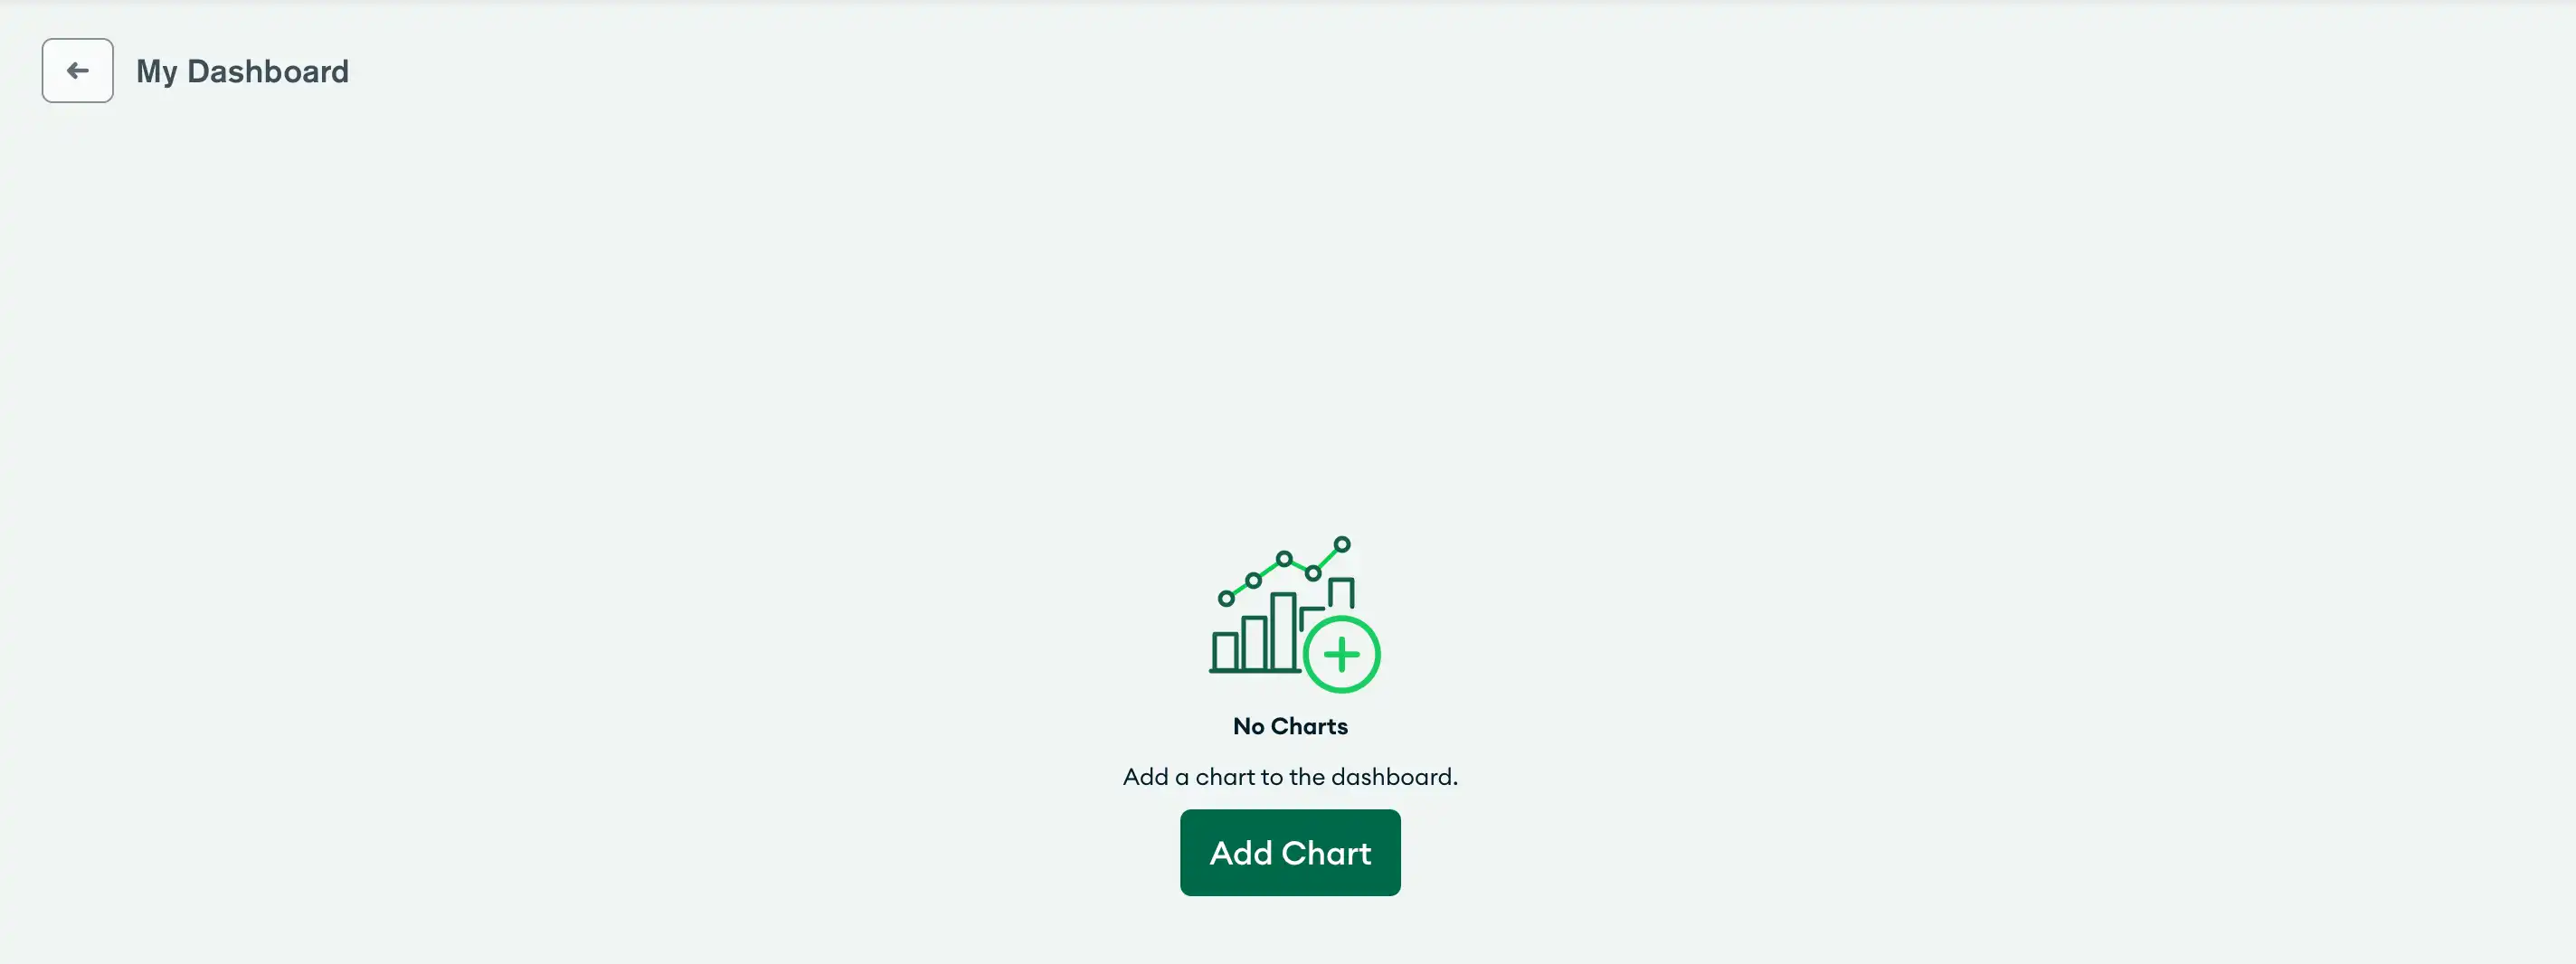
Charts opens your newly created dashboard and prompts you to add the first chart to your dashboard:

Add a Sample Dashboard
Atlas Charts provides several sample dashboards that use various sample data sources. You can add a sample dashboard to explore different examples of charts you can create.
Tip
You can add a new sample dashboard even if you have an existing sample dashboard in your Charts project. This can be useful if you have changed a sample dashboard and want a fresh copy.
To add a sample dashboard:
From the Dashboards page, expand the Add Dashboard dropdown menu and select Add sample dashboard.
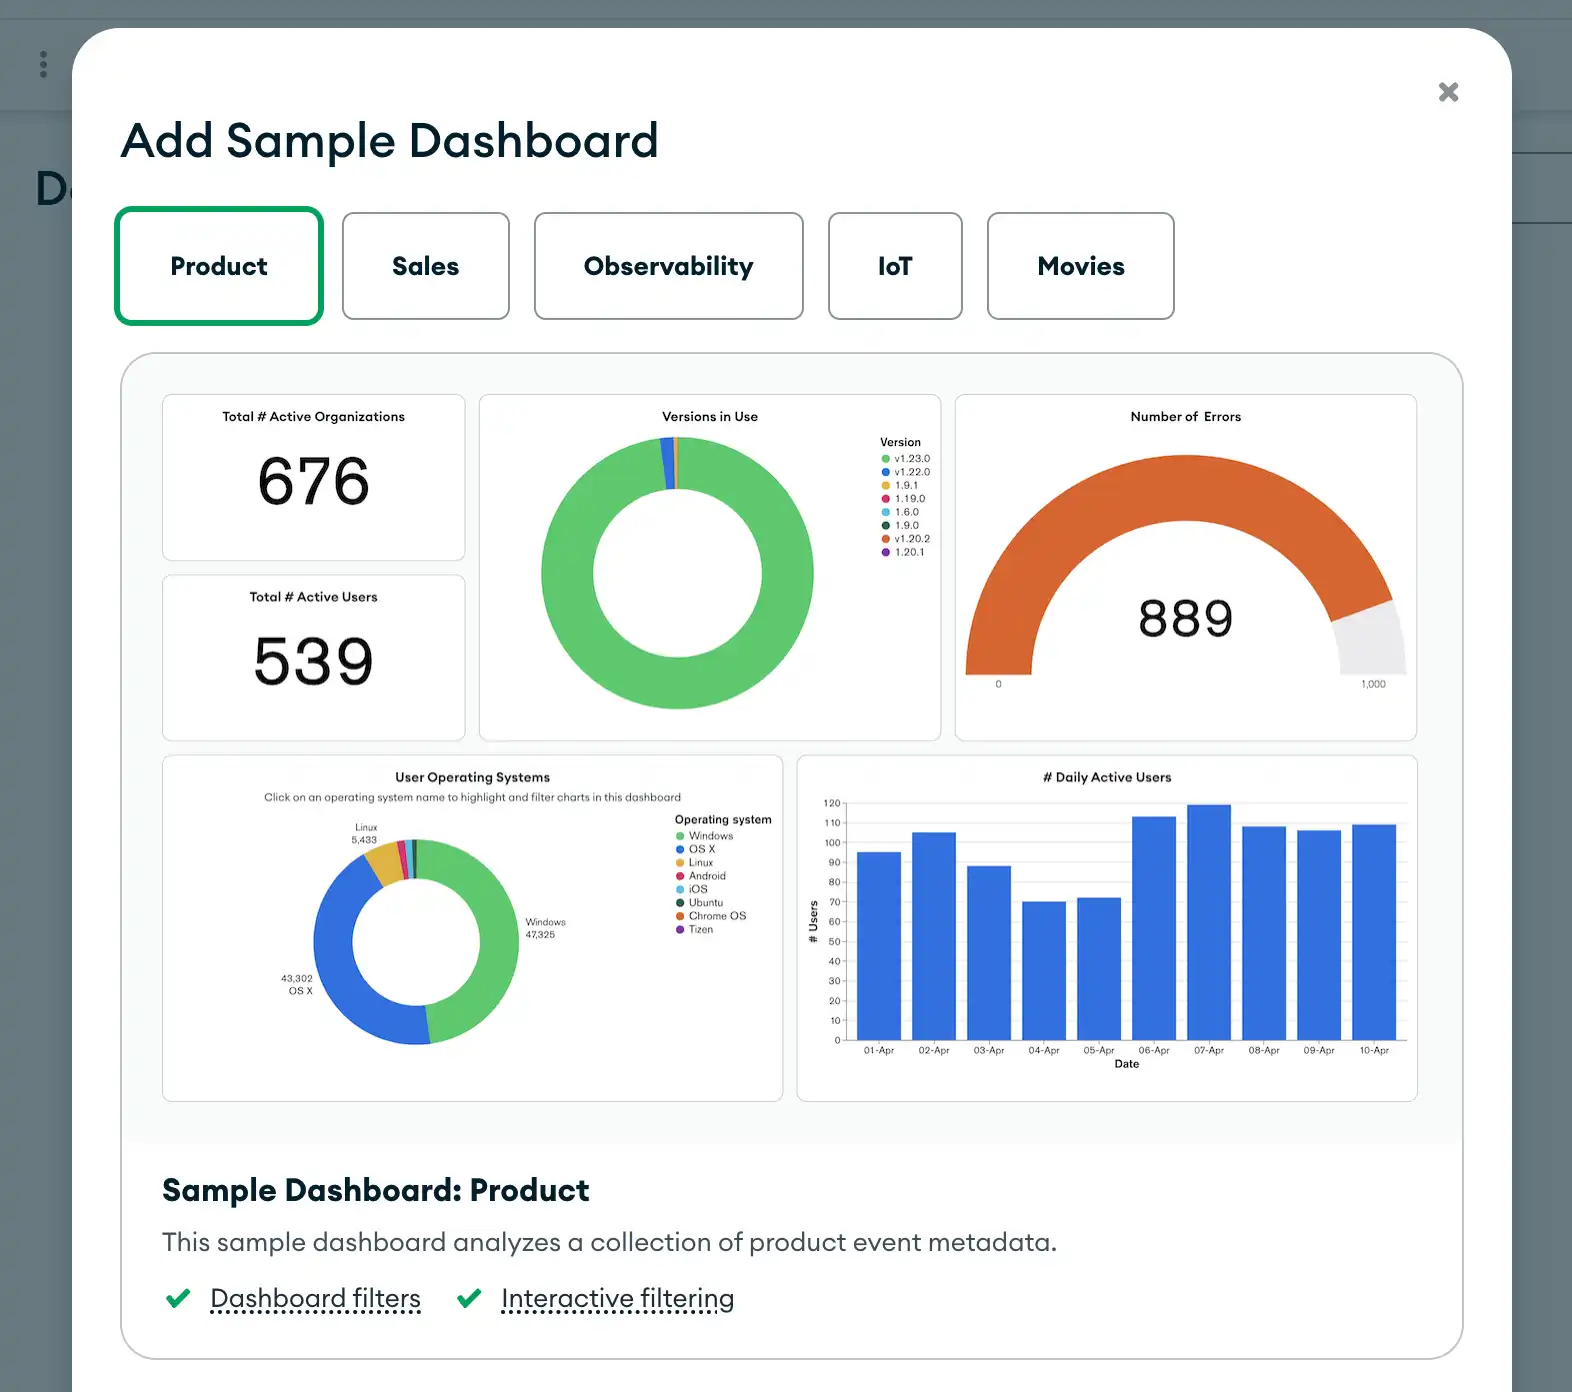
In the Add sample dashboard modal, select a category of sample data with which to create a sample dashboard. You can choose from the following sample dashboards:
Note
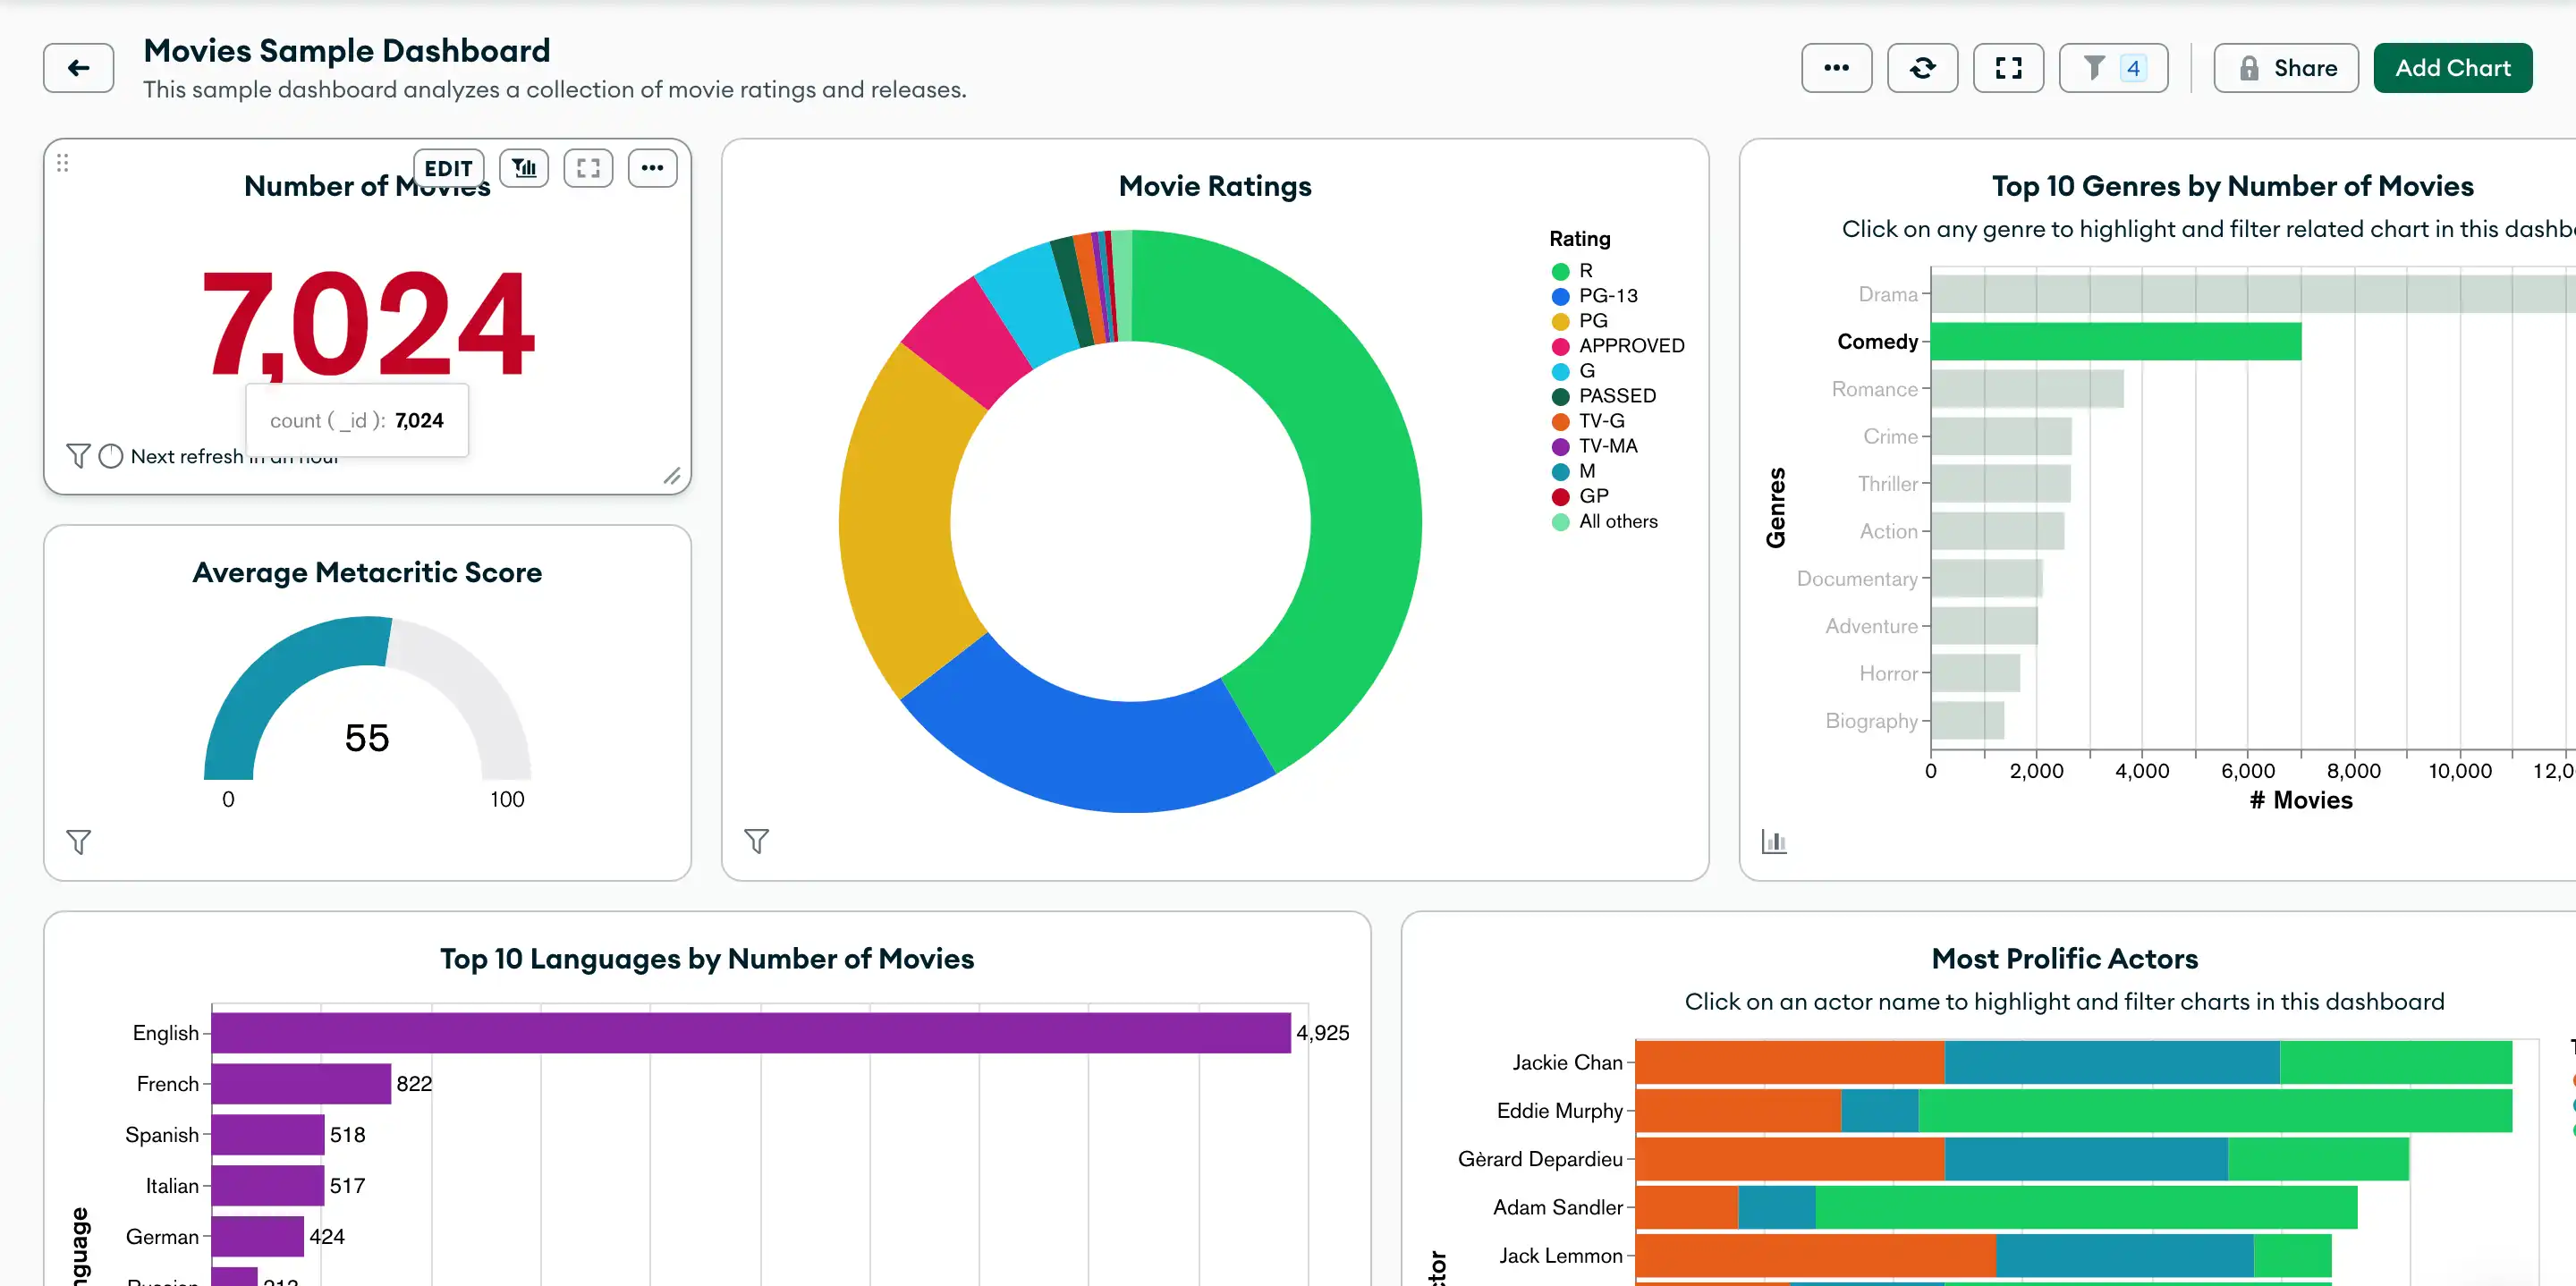
Each of the above links provides a public preview version of a sample dashboard where you can experiment with dashboard filtering and interactive filtering.

Click Add and Open
to create a new Sample Dashboard of which you are the Owner.

You can also create a Sample Dashboard by going through the Charts Welcome Experience.
Sample Dashboard Filters
Sample dashboards come with preset example dashboard filters. You can adjust these filters to modify the data that appears on your dashboard. To learn more about filtering dashboard data, see Filter Dashboards by Field Values.
Add a Billing Dashboard
You can add a billing dashboard in Charts to visualize your Atlas billing data. Billing dashboards contain prebuilt charts with insights into your Atlas usage. To learn more, see Create and Manage Billing Dashboards.