Day 13 of 100daysofcode : The Importance of Gantt Charts in Project Management
Managing projects can feel overwhelming, especially when you’re juggling multiple tasks, deadlines, and team members. This is where Gantt charts come in—a simple yet powerful tool that helps you organize your project visually.
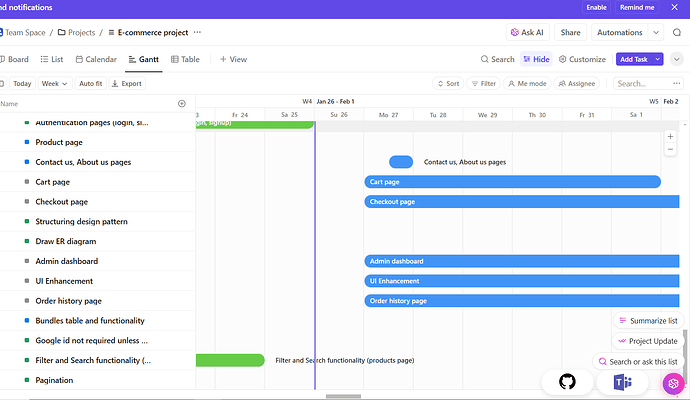
A Gantt chart is like a timeline that breaks your project into smaller tasks. Each task is represented by a bar, showing when it starts and ends. These bars are arranged along a calendar, making it easy to see the order of tasks and how long each one will take. Arrows or lines between tasks show dependencies—meaning which tasks need to be completed before others can begin.
Why Are Gantt Charts Important?
- Clear Project Overview: Gantt charts give you a bird’s-eye view of your project. You can see all the tasks, their deadlines, and how they connect, which helps you stay organized.
- Improved Time Management: With a clear timeline, you can plan your work better and avoid last-minute rushes. It also helps you prioritize tasks that are more urgent.
- Better Team Coordination: Everyone on the team can see the project timeline, understand their responsibilities, and know how their work affects others. This improves communication and reduces confusion.
- Tracking Progress: Gantt charts make it easy to track which tasks are done, which are in progress, and which are delayed. This helps you adjust your plan if something isn’t going as expected.
- Identifying Dependencies: You’ll know which tasks depend on others, so you can avoid bottlenecks or delays caused by missing a step.
Example: Using ClickUp for Gantt Charts
ClickUp is a friendly tool that includes a Gantt chart feature. It allows you to:
- Create Tasks Easily: Add tasks and set start and due dates with just a few clicks.
- Drag and Drop Adjustments: If a deadline changes, you can adjust your Gantt chart by dragging tasks to new dates.
- Track Progress Visually: Completed tasks are marked on the chart, so you always know how much work is done.
- Set Dependencies: You can link tasks to show which ones need to be finished before others can start.
For example, if you’re working on a software project, you might have tasks like “Design UI”, “Develop Backend”, and “Test Features.” Using a Gantt chart in ClickUp, you can see the order of these tasks, assign deadlines, and adjust as needed if one step takes longer than expected.
Below is a simple example that illustrate how we use Gantt chart in ClickUp:
100daysofcode lebanon-mug
1 Like