Peek at your MongoDB Clusters like a Pro with Keyhole: Part 2
This is the second stop on Peek at your MongoDB Clusters like a Pro with Keyhole. In Part 1, we covered how to use keyhole to collect cluster information, generate HTML reports, and review whether the provisioned resources are adequate to support the application. In Part 2, we’ll discuss performance evaluations from FTDC metrics and mongo logs. FTDC, short for Full Time Diagnostic data Capture, is MongoDB's internal diagnostic data stored in a proprietary format. MongoDB records diagnostic information every second.
In part 2 of this blog post you will learn how to:
- Integrate Keyhole with Grafana
- Understand Cluster Performance & Bottlenecks from FTDC data
- Identify Slow Operations from Logs
From the information revealed by Keyhole from reading MongoDB logs and FTDC data, you should be able to identify the performance bottlenecks 95% of the time. The complete code of Keyhole is available from this GitHub repository.
Integrate Keyhole with Granfana
MongoDB servers store FTDC data every second. This data includes mongo server status and many hardware resource metrics. To display FTDC metrics visually, Keyhole reads FTDC data and works as a SimpleJson Datasource to support a Grafana UI. Grafana is an open source analytics & monitoring solution for databases.
Install Grafana and SimpleJson Plugin
Follow Grafana’s installation documents to install Grafana on your favorite OS. For macOS users, after installing Grafana, start Grafana using command:
brew services start grafana
Continue configuring Grafana by navigating to http://localhost:3000 from a browser and install the grafana-simple-json-datasource plugin. For example, on macOS you can use the commands below to install the plugin and restart Grafana service:
grafana-cli plugins install grafana-simple-json-datasource
brew services restart grafana
Add Keyhole as Default Datasource
The next step is to add keyhole as the default datasource. Locate the Data Source tab under Configuration, and configure the SimpleJson datasource as below:
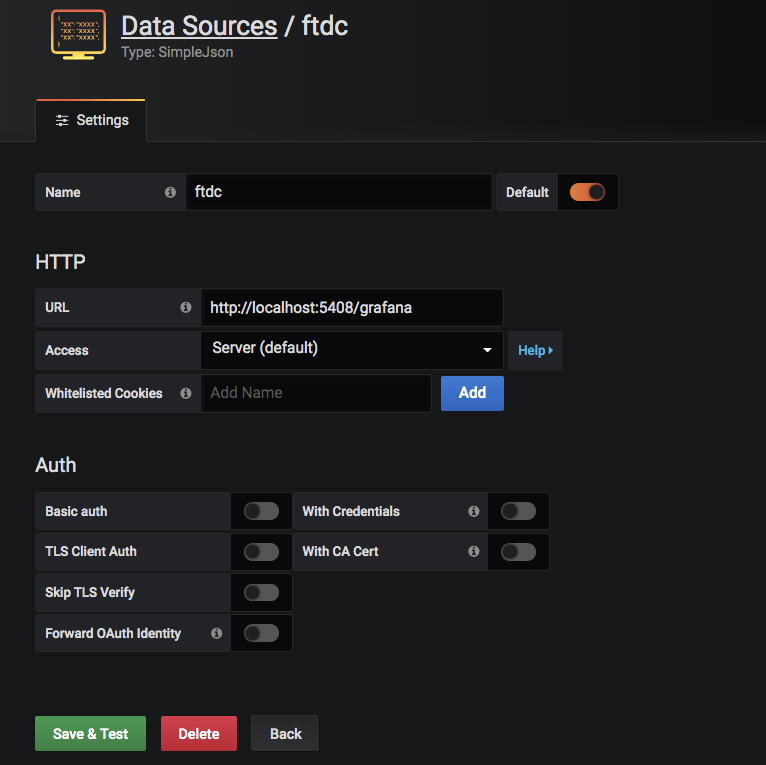
You can ignore the HTTP Error Bad Gateway message for now. The reason that you see the error message is because Keyhole is not started yet.
Import Keyhole FTDC Analytics Template
Download MongoDB FTDC Analytics template from GitHub. On Dashboard, click the New dashboard icon, then import the downloaded file. Use the exact parameters as shown below. These values have to be exact matches to allow Grafana to locate the correct datasource.
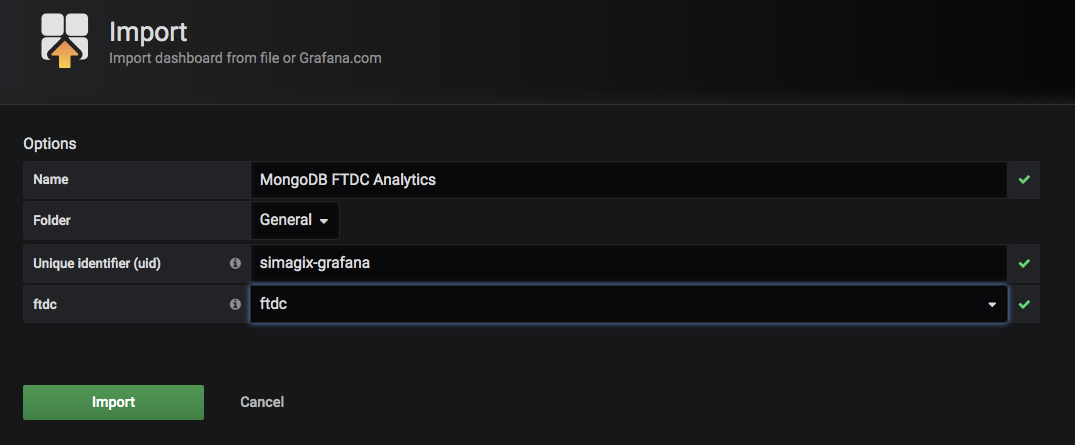
Click the Import button to complete the configuration. You should be redirected to a MongoDB FTDC Analytics dashboard with a number of blank metrics panels.
Understand Cluster Performance & Bottlenecks from FTDC data
The FTDC data files are kept under a directory called diagnostic.data under your mongo database path. Copy the entire diagnostic.data directory (or simply a few files under it) to the computer where you have Grafana and Keyhole installed. Then, start Keyhole as follows:
keyhole --web --diag ./diagnostic.data/

2019/11/25 14:10:43 reading 1 files with 300 second(s) interval
2019/11/25 14:10:43 metrics.2017-10-12T20-08-53Z-00000 blocks: 164 , time: 245.534381ms Memory Alloc = 58 MiB, TotalAlloc = 101 MiB
2019/11/25 14:10:43 1 files loaded, time spent: 245.718665ms
2019/11/25 14:10:43 Stats from 2017-10-12T20:08:54Z to 2017-10-13T04:29:23Z
2019/11/25 14:10:43 host-0 xxx-00:27018
...
2019/11/25 14:10:43 data points ready for xxx-00:27018 , time spent: 1.244537ms
…
http://localhost:3000/d/simagix-grafana/mongodb-mongo-ftdc?orgId=1&from=1507838934000&to=1507868963000
After Keyhole completes reading all FTDC data files, a URL is provided at the end of the console output. Open the link in a browser to see the previous metrics panels filled with charts, for example:
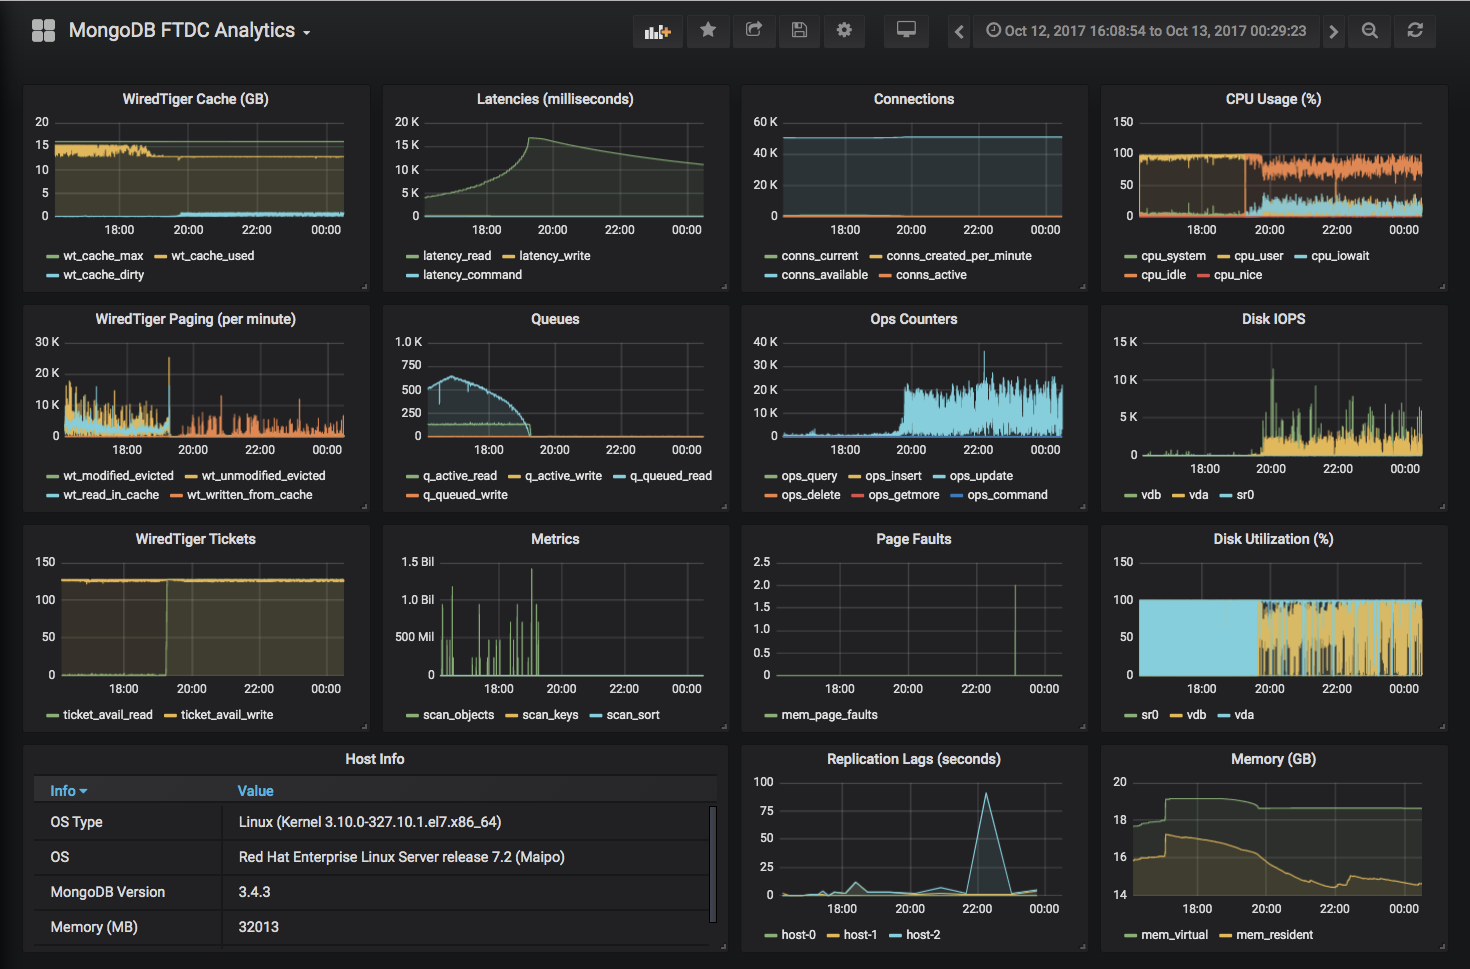
Although these charts present only a few of the MongoDB FTDC metrics, they are enough for me to diagnose the health of a MongoDB cluster. My evaluation steps are outlined below:
WiredTiger Tickets
First of all, check if the WiredTiger tickets dropped to zero at any point in time. In the WiredTiger storage engine, read and write tickets are used to control concurrency. By default, there are 128 read and 128 write tickets. Below is an example of the cluster out of available read tickets at many points of time:

If the server ran out of read tickets, check MongoDB logs for long-running database operations. (We’ll discuss how to identify slow operations later in this blog.) To resolve the running-out-read-tickets problem, solutions can be as simple as adding indexes to improve query performance and free up read tickets quicker. If all queries are supported by proper indexes, but the problems are due to high transaction rate of read operations, consider adding more shards to the MongoDB cluster.
If the server was out of write tickets, the problem is likely disk performance-related, high disk latency or under-provisioned IOPS. Cross-reference the Disk IOPS and Disk Utilization (%) panels to see if it reached the maximum disk IOPS.
The growing number of queues in the Queues panel is a reflection of the WiredTiger Tickets panel. When WiredTiger is out of tickets, subsequent requests will be queued, for example:

Disk IOPS
The line charts of Disk IOPS panel fluctuates fiercely and likely you will see seesaw-shaped charts. However, if the IOPS of a disk device is showing as a plateau line, it’s very likely that the device has reached its maximum provisioned IOPS. The solution is to increase disk IOPS. If you still use spindle disks, consider an upgrade to SSD or NVMe for better performance. MongoDB has good results and a good price-performance ratio with SATA SSD.

WiredTiger Tickets and Disk IOPS panels are the first two I’ll review. The other panels can show different bottlenecks and/or potential problems. Different cases have very different chart patterns.
WiredTiger Cache (GB)
The wt_cache_dirty, shown in the chart below, indicates data in the cache that has been modified but not yet flushed to disk. Growing amounts of dirty data usually implies that the rate of writing to the database overwhelms the provisioned disk IOPS.

Metrics
A high number of scan_objects with a low number of scan_keys is typically an indication of a missing index or inefficient indexes used by mongo query engine. A growing number of scan_sort implies that the mongo query engine didn’t use an index key to sort. Instead, it had to load all documents into memory before sorting. In either case, we can identify them from mongo logs - see discussions below in Identifying Slow Operations from Logs. The chart below is an example of a Metrics panel of a cluster that has a high transaction rate of reads.

Connections
I look at the conns_created_per_minute to find if connection pools were always used. Ideally, when connection pools are used, there should be a minimal number of connections created per minute. If you see spikes of conns_created_per_minute like the below chart, ask your developers if all applications use connection pools.

CPU Usages (%)
If a system is properly provisioned, you shouldn’t see CPU pegged out, i.e. 0% of CPU idle. If you have slow disks with a high transaction rate of writes, you will probably see a growing percentage of cpu_iowait. If your mongo server is a virtual machine hosted on a resource overcommitted host, you could see a high flying line of cpu_system even though the mongo server itself has low activity because other VMs could possibly use the CPU cycles heavily.

Replication Lags (seconds)
Replication lag represents a delay between an operation on the primary and the application of that operation from the oplog to the secondary. This chart is only available when diagnosing a replica set. This metric shows how far a secondary is behind the primary. A high replication lag can be due to networking issues, slow oplog applying in secondary nodes, and/or insufficient write capacity. Below is an example:

Other than application tuning, better hardware (faster network switches and/or disks) is likely required to reduce replication lags. A common solution is to replace existing servers with better hardware or to add more shards. Before a new solution is in place, make sure there is enough oplog window (the interval of time between the oldest and the latest entries in the oplog) to avoid losing data.
Identifying Slow Operations from Logs
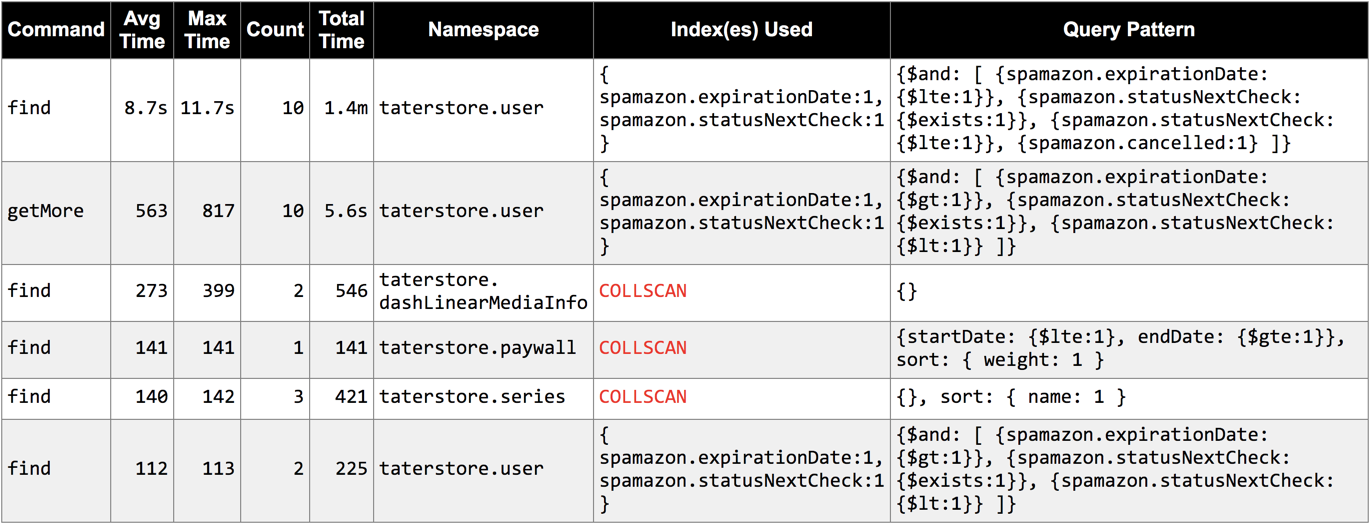
Keyhole, with --loginfo flag, reads mongo logs and prints a summary of slow operations grouped by query patterns (filters). The input files can be either plain texts or gzipped files. Being able to read gzipped files comes handy. Below is an example result.
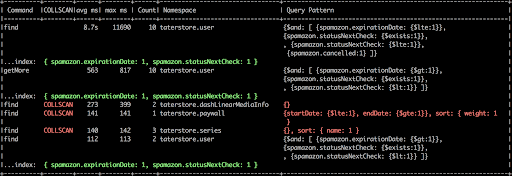
The complete usage of log analytics is as follows:
keyhole --loginfo log_file[.gz] [--collscan] [-v]
With the -v flag, Keyhole also prints the original logs of the top 20 slow operations. In addition, with the --collscan flag, Keyhole only outputs operations missing indexes. A query pattern marked as COLLSCAN means that it didn’t use an index and adding a proper index should resolve this. On the other hand, even if an index was used it might not be efficient enough to support the query pattern. It’s quite possible to find indexes that are optimized for querying and others for sorting. Compound indexes can be structured to optimize for both whenever possible.
Note that there is an output file with a “.enc” extension created upon the completion of log parsing. This is designed for those administrators who are reluctant or prohibited to copy log files out of the servers. Instead, they can process the logs on the server and later view the summary by using the command below:
keyhole --loginfo mongodb.log.enc
Or, you can use Maobi to generate an HTML report to have a more user-friendly view of the results. Below is an example report:
Recap
Combined with methods described in Part 1, you can use the Keyhole tool to quickly identify performance bottlenecks and tune them accordingly. In summary, Keyhole helps you to:
- Verify new installations
- Collect MongoDB cluster information including configurations and statistics
- Visualize resource usages in a snapshot
- Identify performance bottlenecks and slow database operations
As always, I would love to hear from you about the Keyhole tool. Please get in touch to let me know your thoughts.